I recently read an article in which the winner of a Kaggle Competition was not shy about sharing his technique for winning not one, but several of the analytical competitions.
“I always use Gradient Boosting,” he said. And then added, “but the key is Feature Engineering.”
A couple days later, a friend who read the same article called and asked, “What is this Feature Engineering that he’s talking about?”
It was a timely question, as I was in the process of developing a risk model for a client, and specifically, I was working through the stage of Feature Engineering.
The act, or I should say the “art” of Feature Engineering takes time – in fact, it takes much more time than building the actual model, and because many clients desire a quick return regarding analytics, I was giving some thought to explaining the value that I perceived in the effort being put forth regarding the engineering of features from their data.
But first, I needed to respond to my friend’s question, and I began by describing the environments in which we typically work; “the companies we work with are not void of analytical talent, in fact some institutions have dozens of highly qualified statisticians with many years of experience in their respective fields. Still, they may not be getting the results from their models they are expecting.”
I was quickly asked, “So, how do you get better results? Neural Nets? Random Forests?”
“It’s not the method that sets my results apart from theirs,” I answered. “In fact, the success of my modeling projects is generally solidified before I begin considering ‘which’ method.” I paused and pondered how to continue, “Before I consider methods, I simply derive more information from their data than they do, and that is Feature Engineering.”
Feature Engineering
Feature Engineering is a vital component in the process of attaining extraordinary Machine Learning results, but it doesn’t merit as many intriguing conversations, papers, books or talks at conferences. Regardless, I know the successes due my projects that are typically attributed to the application of Machine Learning techniques is actually due effective Feature Engineering that not only improves the model, but also creates information that the clients can more readily understand.
How did I justify the time spent “Feature Engineering” to the client mentioned above? First, I developed a model with PROC LOGISTIC using only the primary data given to me and called it “Model 1.”
Model 1 was then compared to “Model 2,” a model built using the primary data plus the newly developed features. Examples of those new features that proved significant were those constructed as follows:
- Ratios of various events relative to time.
- Continuous variables dimensionally reduced into categories.
- Simple counts of events.
And then I proactively promoted the findings!
I often use the OUTROC option to output the necessary components such that I can create a chart of ROC curves using PROC SGPLOT. An example of this process can be viewed in Graph 1 where the value of Feature Engineering is clearly evident in the chart detailing the curves from both models: the c-statistic improved from 0.70 to 0.90.
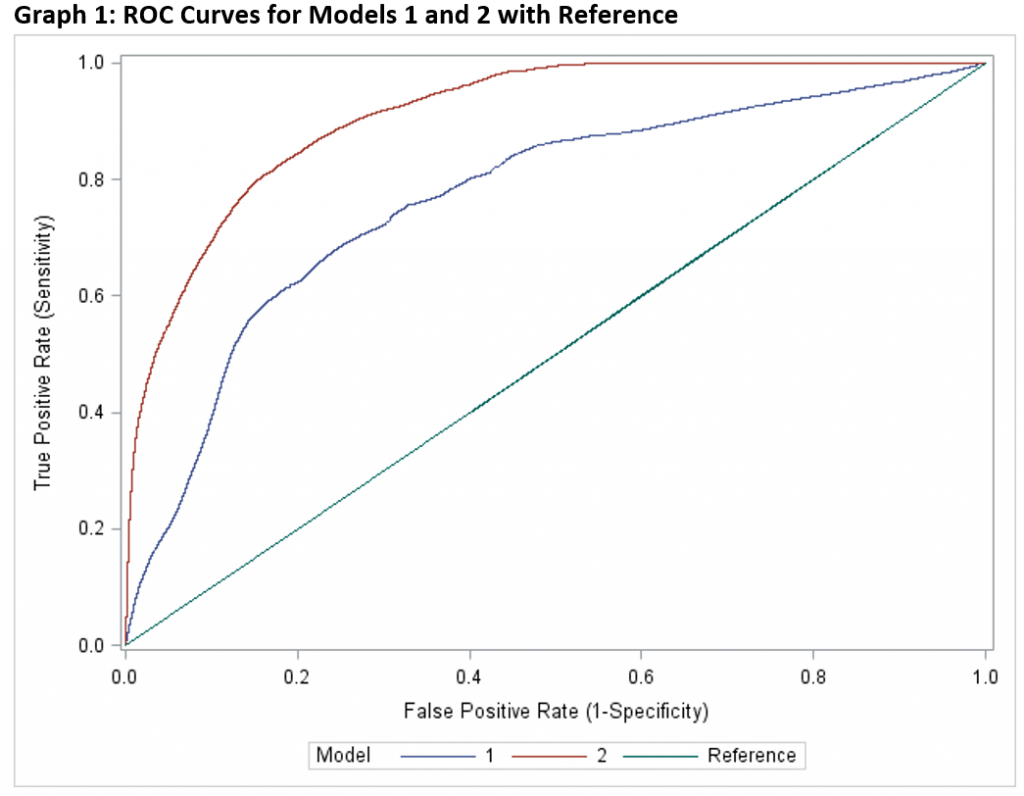
However, there is still a story to be shared as improvement is not only represented as a stronger c-statistic, but rather the in the actual classification of default. For example:
- Model 1 correctly predicts default in 20% of accounts categorized as “most likely to default,” but it misses on 80%!
- Model 2 correctly predicts default in 86% of those accounts it categorizes as most likely to default, but misses on only 14%.
How did this happen?
While we could drill down into a discussion of significant factors to seek an in-depth explanation of the results, a more general observation is simply this: Model 2 accomplishes its mission by correctly reclassifying a substantial portion of the population as “low risk” and leaves those with default concerns to be assessed with greater consideration.
Essentially, the default model is vastly improved by better discerning those customers who we need not worry about leaving an uncluttered pool of customers that require attention (see Graph 2).
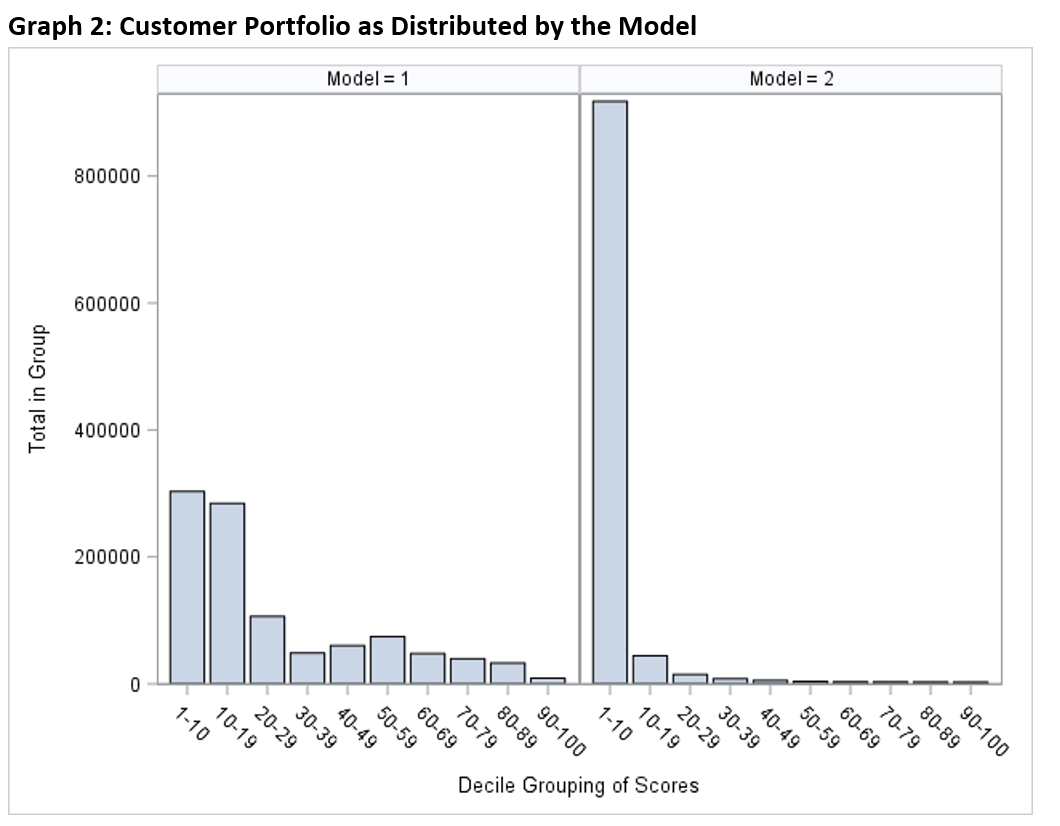
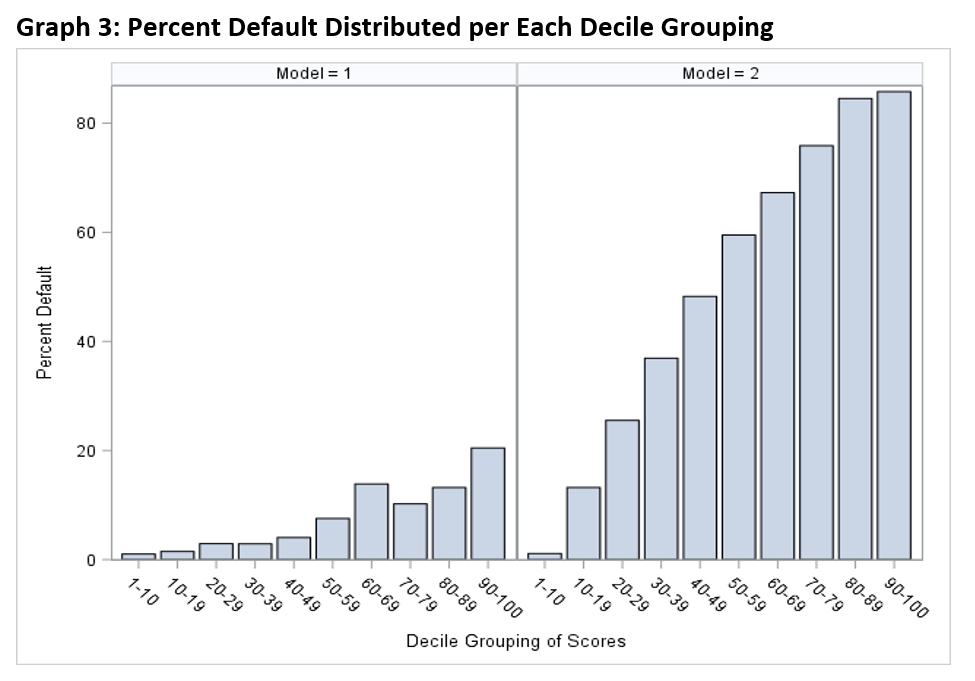
Instead of assessing the default potential for 900,000 accounts, the model instead deals with 100,000 “risky” accounts. It essentially improves its chances of success by creating a more “easy to hit” target, and the result (see Graph 3) is that when it categorizes an account as “high risk” it means it!
Thanks to Feature Engineering, the business now possess very actionable information.
How Do I Engineer the Features Necessary to Attain Such Results?
Working from the SAS Data Step and select SAS Procedures, I work through a process in which I attempt to create useful features with the following techniques and methods:
- Calculate statistics like the minimums, maximums, averages, medians and ranges thinking that extremes (or the lack) might help define interesting behaviors.
- Count occurrences of events considering that I might highlight statistically interesting habitual behaviors.
- Develop ratios seeking to add predictive value to already analytically powerful variables as well as to variables that might have previously lacked statistical vigor.
- Develop quintiles across variables of interest seeking to create expressive segments of the population while also dealing with extreme values.
- Apply dimensionality reduction techniques, ranks, clustering etc. expecting that grouping those with similar behaviors will be statistically beneficial.
- Consider the element of time as an important interaction with any feature that has been developed.
- Use regression to identify trends in continuous variables thinking that moves up or down (whether fast or slow) will be interesting.
As with the guy who won the Kaggle competitions, I’ve now revealed some of my secret weapons regarding the building of successful models.
What’s your secret weapon?

1 Comment
These are great tips. Depending on your field, the literature may also provide evidence of features.
I would be interested to read the article to which you allude.