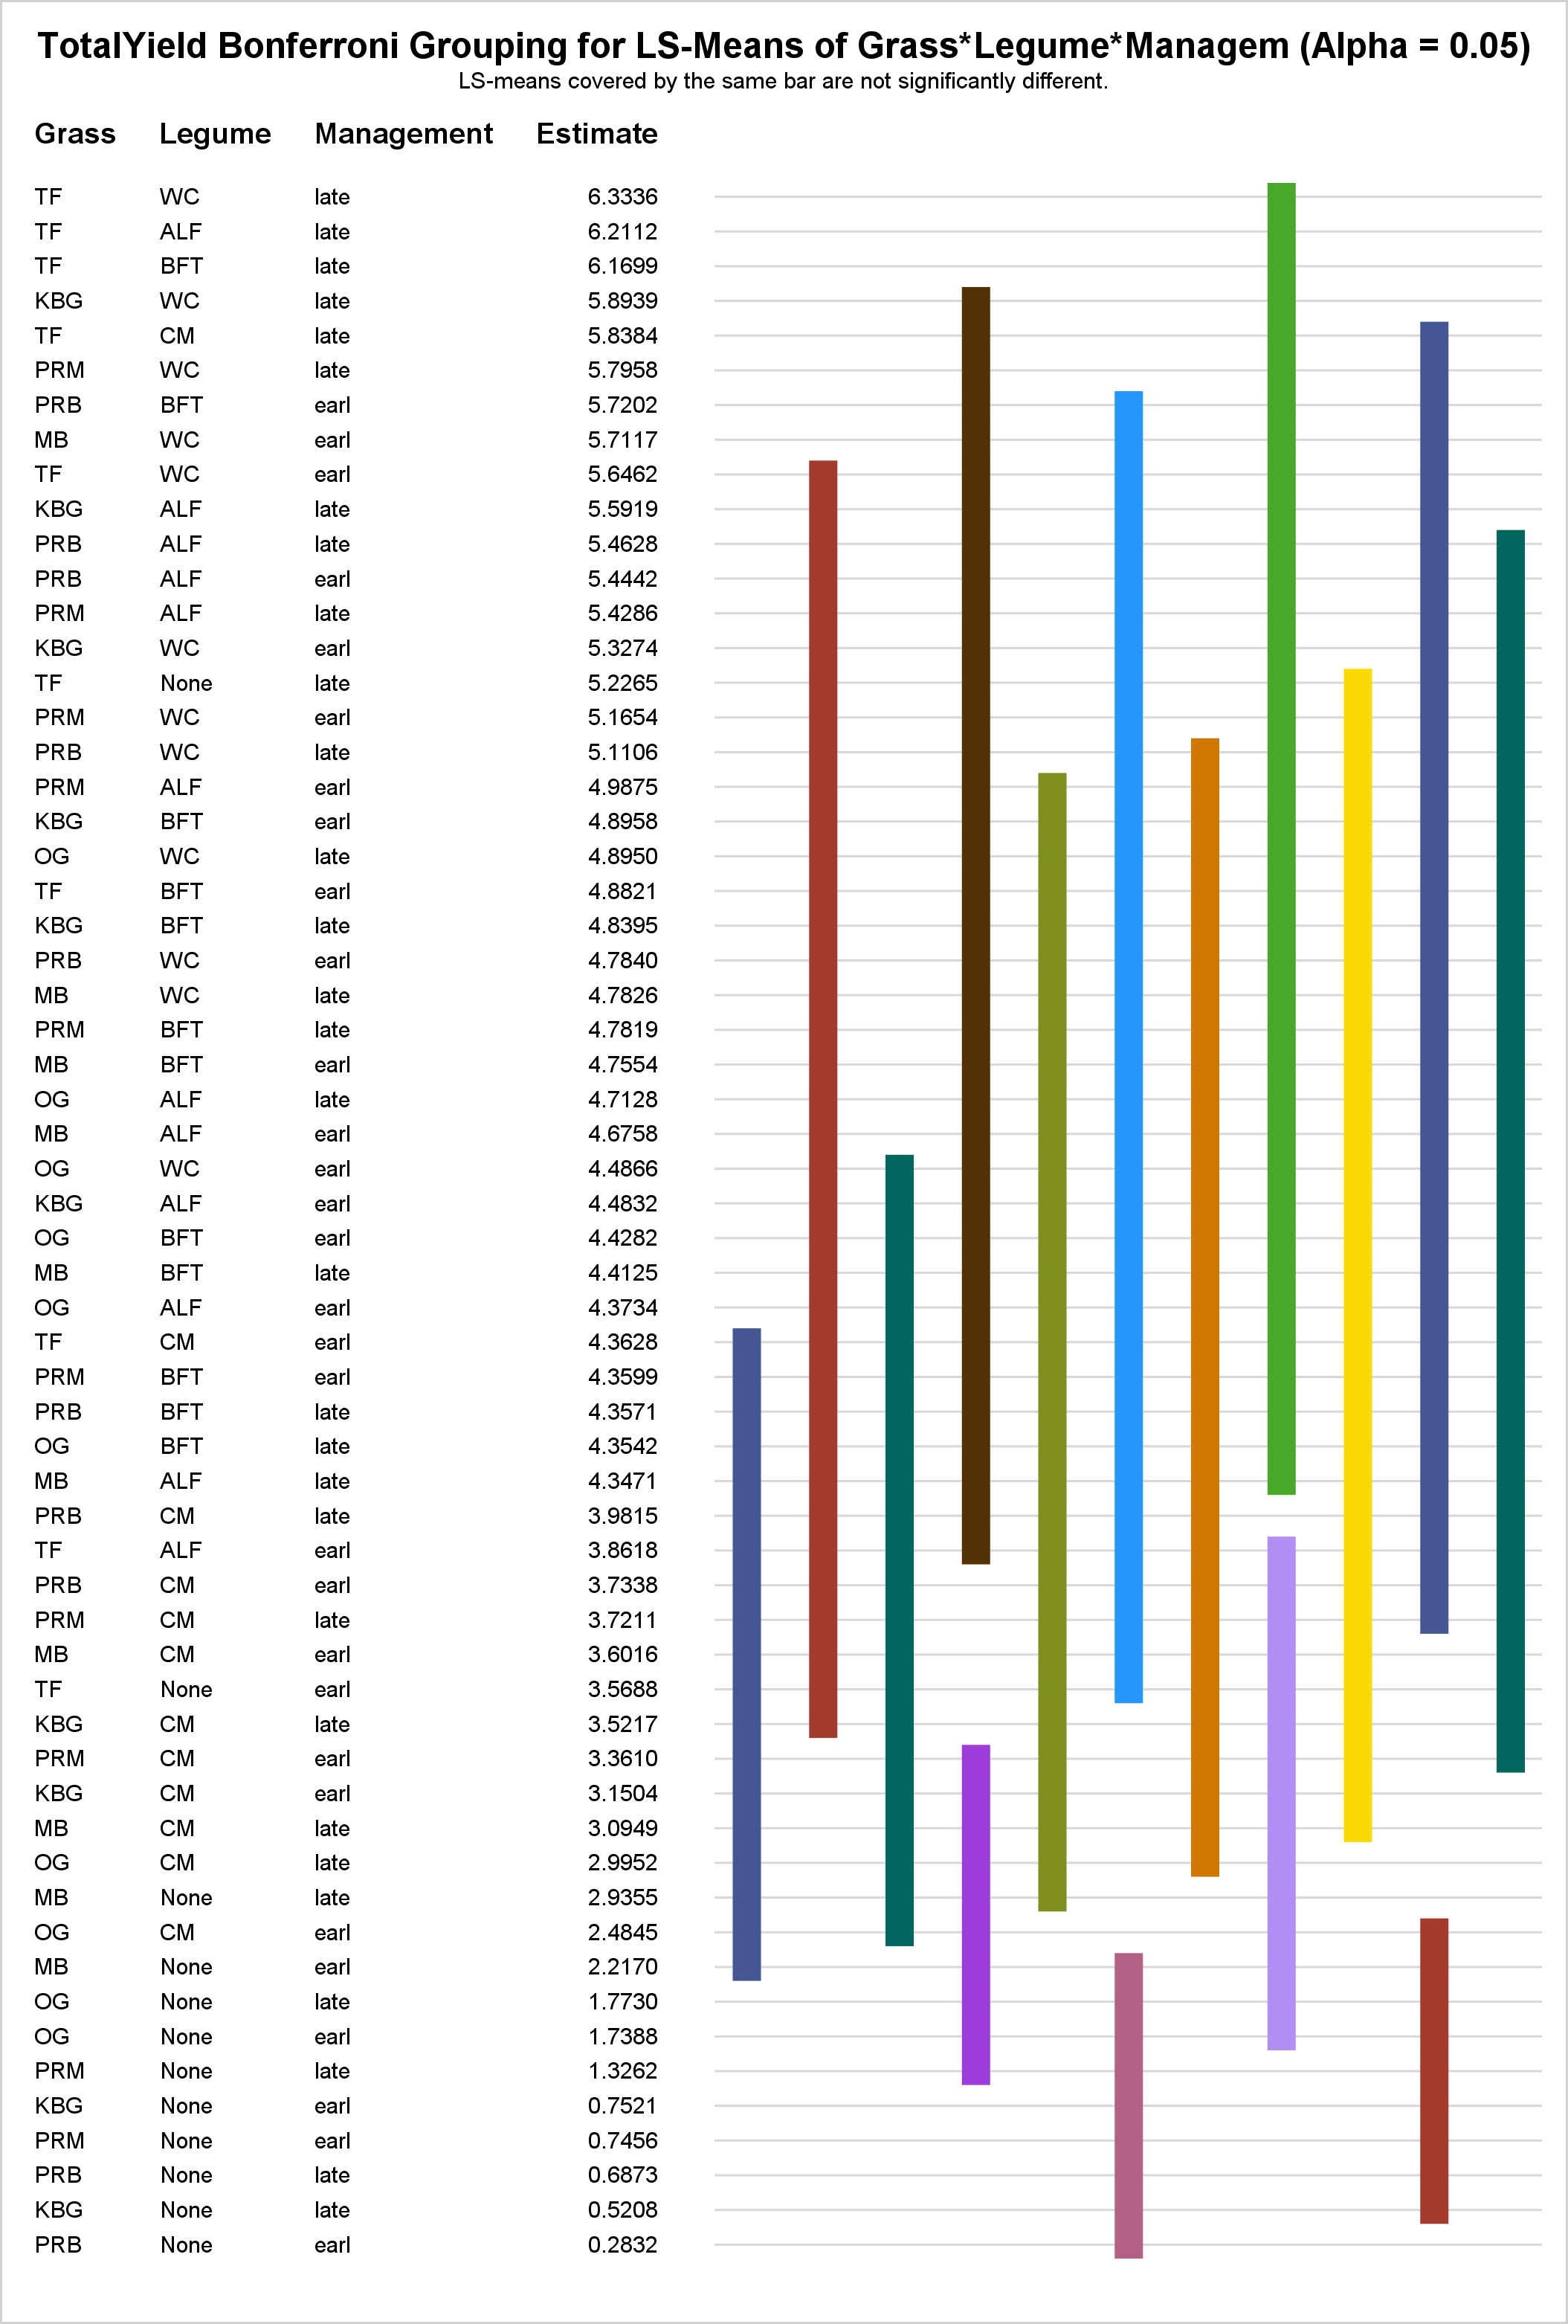
In PROC GLM and most other procedures that compute LS-means, mean comparisons are now displayed graphically. This makes comparisons between a large number of groups easier to interpret.
It's as easy as walking, right? Well, give it a try. October’s move of the month is the “Farmer’s” Carry. It is a SUPER-simple, full body, traveling exercise. It incorporates core stabilization and a familiar daily activity - walking. All you have to do is walk + carry something...preferably
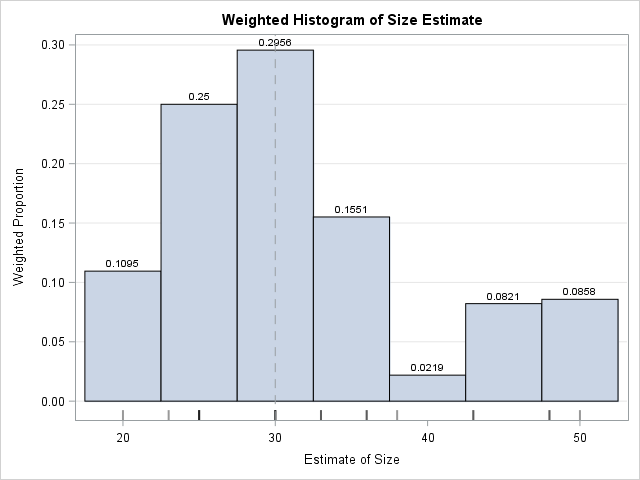
If you perform a weighted statistical analysis, it can be useful to produce a statistical graph that also incorporates the weights. This article shows how to construct and interpret a weighted histogram in SAS. How to construct a weighted histogram Before constructing a weighted histogram, let's review the construction of