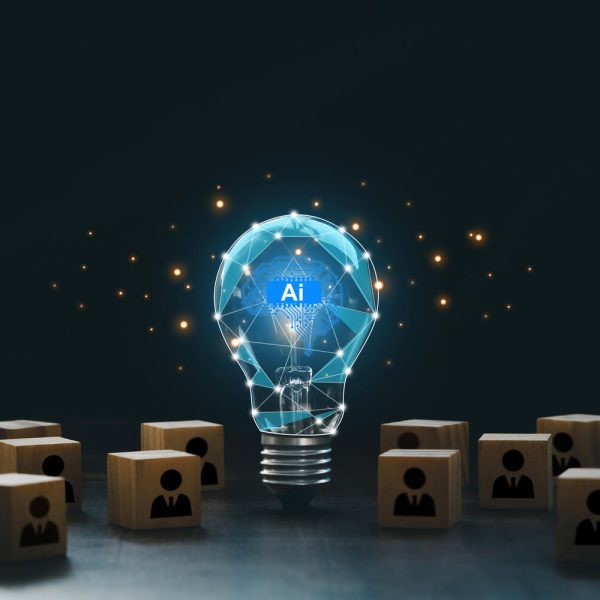
Insurance

Analytics | Risk Management
Thorsten Hein 0
IFRS-17-Architektur: ein Systemansatz

Nach den ersten beiden Beitragen zum Thema IFRS-17-Umsetzung (Teil 1 und Teil 2) geht es nun ans „Eingemachte”: die Architektur und die Systeme, die für eine 100-prozentige Erfüllung der Richtlinie benötigt werden. Voraussetzung ist eine enge Zusammenarbeit zwischen den verschiedenen Abteilungen, darunter Bestandsverwaltung, Rechnungswesen, Aktuariat und IT. Rund um die IFRS

Analytics | Risk Management
Thorsten Hein 0
IFRS 17 und IT: ein Lösungsansatz

Welche einschneidenden Veränderungen IFRS 17 für Versicherer unter anderem für das Rechnungswesen und die Finanzabteilung mit sich bringt, habe ich in meinem vorangegangenen Blogbeitrag erläutert. Ein weiterer wichtiger Aspekt ist die Implementierung von Technologie, die bei der Umsetzung der Richtlinie hilft, und damit verbundene spezifische IT-Fragen. Die Richtlinie tritt doch erst

Analytics
Andreas Becks 0
Innovation in der Versicherungswirtschaft: Wie „junge Wilde“ den Laden aufmischen

Im Kölner Stadtteil Mülheim und unweit der Keupstraße mit ihrem orientalischen Charme aus Dönerrestaurants, Baklava, Cafés und Moscheen, neben alten Backsteinhallen mit Konzertsälen und Fernsehstudios liegt mit dem Carlswerk eine große ehemalige Industriefläche, die mittlerweile zum Gewerbegebiet mit vielen jungen und etablierten Unternehmen, Restaurants und Freizeitmöglichkeiten geworden ist. Im sogenannten

Analytics | Risk Management
Thorsten Hein 0
IFRS 17 – ein neues Paradigma im Rechnungswesen

Der neue International Financial Reporting Standard (IFRS 17) stellt Versicherer vor Veränderungen, wie sie die Branche selten zuvor erlebt hat. Die Vorgaben sollen die Transparenz im Finanzberichtswesen verbessern und außerdem eine Grundlage für die Vergleichbarkeit mit anderen Branchen schaffen. Analysten und andere Branchenspezialisten haben diese Vergleichbarkeit schon seit langer Zeit

Analytics | Internet of Things
보험 업계, 사물인터넷(IoT) 데이터로 예방 기반의 비즈니스 모델 도입

사물인터넷(IoT)이 보험사의 운영 방식은 물론 보험 가입자 개개인의 삶의 방식을 변화시키면서 보험 업계에 새로운 세계가 열렸습니다. 기술이 더욱 더 스마트해지고 연결되면서 예방 가능한 비즈니스 모델로 빠르게 전환되고 있는데요. 사물인터넷 시대에 적응하지 못하는 보험사는 새로운 진입자 그리고 새로운 생태계 및 시장 수요에 성공적으로 대응한 기업들에 밀려 토이저러스(Toys R Us)와 같은 신세를 피하기 힘들

Analytics | Artificial Intelligence | Fraud & Security Intelligence | Machine Learning
Héctor Cobo 0
SAS Global Forum: Los datos se transforman en inteligencia

La fortaleza que tiene la analítica ahora es la revolución de las tecnologías como la inteligencia artificial (IA) y el aprendizaje automático. Esta amalgama de innovaciones le da a las empresas, de todas las industrias, la oportunidad de llevar a cabo las percepciones que obtienen de sus datos a una

Analytics | Data for Good | Internet of Things | Machine Learning | SAS Events
Gloria Cabero 0
SAS Global Forum, inspiración para hacer lo extraordinario

+Las empresas de todo el mundo están cambiando radicalmente su manera de operar y de relacionarse con clientes y socios. Se encuentran en plena transformación digital y capitalizan tendencias clave para evolucionar, como la nube, el Internet de las Cosas, la inteligencia artificial y la analítica, entre otras. De igual

Data Visualization | Learn SAS | Programming Tips
Sanjay Matange 0
Survival plot with a twist using SGPLOT procedure

Survival plots are automatically created by the LIFETEST procedure.  These graphs are most often customized to fit the needs of SAS users.  One way to create the customized survival plot is to save the generated data from the LIFETEST procedure, and then use the SGPLOT procedure to create your custom

Analytics | Fraud & Security Intelligence | Risk Management
Jeanne (Hyunjin) Byun 0
현대해상, ‘보험사기인지시스템(IFDS)’ 고도화로 보험사기 리스크 관리 강화

금융감독원에 따르면 2017년 상반기 적발된 보험 사기 금액은 전년 동기 대비 6.4% 증가한 3,703억원으로 역대 최고치를 기록했습니다. 또한 보험연구원은 2014년 기준 보험 사기로 인한 누수 금액이 무려 4조5,000억원에 달하는 것으로 발표했는데요. 특히 전문 브로커가 연루되는 등 사기 수법 또한 지능적, 조직적으로 진화함에 따라 보다 체계적인 조사 방식과 분석 시스템의 필요성이 높아지고

Fraud & Security Intelligence | Risk Management
Jeanne (Hyunjin) Byun 0
새 국제회계기준 ‘IFRS 17’, 보험 업계 정조준

여전히 많은 금융 기관들이 국제회계기준(IFRS; International Financial Reporting Standard) 9를 준수하기 위해 애쓰는 가운데, 2021년부터 시행될 새로운 규정인 IFRS 17에 대한 부담이 보험 업계 전반에 긴 그림자를 드리우고 있습니다. 이미 IFRS 9의 새로운 보고 기준은 은행과 금융 기관에 전혀 새로운 차원의 거버넌스와 통제를 요구하고 있으며, 각 기관은 이를 지원하기 위해 IT

Analytics | Fraud & Security Intelligence | Machine Learning
SAS Korea 0
유럽 보험 업계, 인공지능(AI)으로 혁신을 꾀하다

일본의 한 보험 회사가 올해부터 보험 계약 절차와 정보 조회 등 사무 작업의 90%를 인공지능(AI)으로 대체, 전사 업무 부담을 20% 가량 경감할 것으로 발표하며 이목을 모았습니다. 국내에서도 이처럼 보험과 IT 기술을 융합한 인슈어테크(Insure + Tech) 서비스가 속속들이 출시되며 보험 업계의 비즈니스 모델이 빠른 속도로 다각화되고 있는데요. 오늘은 보험 선진국으로 평가 받는 유럽의

Advanced Analytics | Analytics | Risk Management
Hartmut Kömme 0
Was bringt die Zukunft? Auswertung von Risiko-Szenario-Pfaden

Die Abbildung einer möglichen zukünftigen Situation ist eine Kernaufgabe des Risiko-Managements. Dazu werden unterschiedlich komplexe Modelle mit möglichen Szenarien durchgerechnet. Hierbei erhält man pro Szenario und Vorhersage-Zeitpunkt ein Ergebnis. Bei mehrperiodischen Vorhersagen (z. B. bei Kredit-Portfolien oder Lebensversicherungen) gibt es pro Szenario einen Ergebnis-Pfad. Im Folgenden zeige ich, wie man mit

Data Visualization | Learn SAS | Programming Tips
Sanjay Matange 0
Little things go a long way

In my previous post, I described a new options to control the widths of the caps for Whiskers, Error and Limit bars.  This topic could have been titled "Little things go a long way", as such details really make for a good graph. In a similar manner, another detail issue

Customer Intelligence
Oliver Börner 0
Richtige Kfz-Versicherung oder nicht …? Das zeigt sich erst, wenn was passiert

Autounfall und positives Kundenerlebnis? Wie passt das denn zusammen? Vor einigen Monaten ist es dann doch passiert: einmal unaufmerksam gewesen und Auffahrunfall in der Stadt verursacht. So ein Mist! Nicht wirklich schlimm – nur ein bisschen Blechschaden, aber super ärgerlich … Nachdem das Auto abgeschleppt und der erste Ärger verflogen

Data Visualization | Learn SAS | Programming Tips
Sanjay Matange 0
Spark table

In the previous post, I discussed creating a 2D grid of spark lines by Year and Claim Type.  This graph was presented in the SESUG conference held last week on SAS campus in the paper ""Methods for creating Sparklines using SAS" by Rick Andrews.  This grid of sparklines was actually the

Data Visualization | Learn SAS | Programming Tips
Sanjay Matange 0
Spark grid

The 25th annual SESUG conference was held at in the SAS campus this week.  I had the opportunity to meet and chat with many users and attend many excellent presentations.  I will write about those that stood out (graphically) in my view. One excellent presentation was on "Methods for creating

Data Visualization | Learn SAS | Programming Tips
Sanjay Matange 0
Legend order redux

Once in a while you run into a pesky situation that is hard to overcome without resorting to major surgery.  Such a situation occurs when you have a stacked bar chart with a discrete legend positioned vertically on the side of the graph.  A simple example is shown below. title

Data Visualization | Learn SAS | Programming Tips
Sanjay Matange 0
Legend items

Plot statements included in the graph definition can contribute to the legend(s).  This can happen automatically, or can be customized using the KEYLEGEND statement.  For plot statements that are classified by a group variable, all of the unique group values are displayed in the legend, along with their graphical representation

Data Visualization | Learn SAS | Programming Tips
Sanjay Matange 0
Tips and tricks: Segmented discrete axis

The previous post on Multiple Blank Categories showed how to include multiple blank categories on the axis.  But, given the purpose for this was to separate different segments in the data, I also included ideas on how to segmented a discrete axis using reference lines or Block Plot.  A similar idea

Advanced Analytics | Analytics | Machine Learning
Andreas Becks 0
Künstliche Intelligenz in der Versicherung: Wo steht Europa?

Wo steht eigentlich die europäische Versicherungswirtschaft in puncto Advanced Analytics, KI und Automatisierung? Erleben wir, dass gerade auch in der Assekuranz traditionelle Verfahren der Datenanalyse mit dem Begriff „maschinelles Lernen" überklebt werden? Oder ist die Branche hier schon deutlich weiter? Sind beispielsweise echte Chatbots wirklich schon allgegenwärtig? Aktuelle Einblicke gibt

Data Visualization | Learn SAS | Programming Tips
Sanjay Matange 0
Tips and tricks - Multiple blank categories on axis

Off and on, users have expressed the need to include multiple blank categories on a discrete axis.  Often, this is desirable to separate groups of bars (or categories) in a graph due to some difference their definition.  Such a case was discussed in this blog article on using non breaking

Data Visualization | Learn SAS | Programming Tips
Sanjay Matange 0
New Features in SAS 9.40M5 - Gradient fills

ODS Graphics procedures primarily strive towards the following goal:  "Make simple graphs easy and complex graphs possible".   SGPLOT procedure allows you create simple graphs with a single plot statement, and create complex graphs by layering together or combining multiple plot statements.  Generally, the appearance follows the guidelines set by industry

Data Visualization | Learn SAS | Programming Tips
Sanjay Matange 0
New features with SAS 9.40 M5

SAS 9.4 maintenance release 5 was released on Sept 19, 2017.  This release includes many new items including integration with SAS Viya and SAS Studio, a web application for SAS development.  Also Included with this release are some cool new features in the graphics domain, some of which were requested

1 5 6 7 8 9 10