The DO Loop
Statistical programming in SAS with an emphasis on SAS/IML programs
In 2024, I wrote about 80 articles for The DO Loop blog. My most popular articles were about SAS programming, data visualization, and statistics. If you missed any of these articles, here is the "Reader's Choice Awards" for some of the most popular articles from 2024! SAS Programming The following

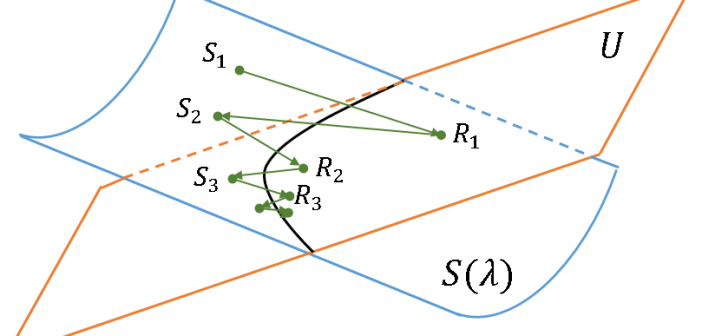
A previous article discusses how to generate a random covariance matrix with a specified set of (positive) eigenvalues. A SAS programmer asked whether it is possible to produce a correlation matrix that has a specified set of eigenvalues. After discussing the problem with a friend, I am happy to report

O Christmas tree, O Christmas tree, How lovely are your branches! SAS programmers have a long history of creating yuletide-themed graphics. Christmas trees are a popular image because of their simplicity. I admit that I have indulged more than once in this holiday tradition: An old-school ASCII art image A
