The DO Loop
Statistical programming in SAS with an emphasis on SAS/IML programs
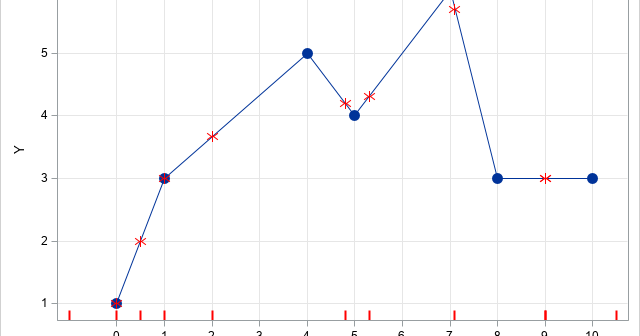
SAS programmers sometimes ask about ways to perform one-dimensional linear interpolation in SAS. This article shows three ways to perform linear interpolation in SAS: PROC IML (in SAS/IML software), PROC EXPAND (in SAS/ETS software), and PROC TRANSREG (in SAS/STAT software). Of these, PROC IML Is the simplest to use and

Recently I read an excellent blog post by Paul von Hippel entitled "How many imputations do you need?". It is based on a paper (von Hippel, 2018), which provides more details. Suppose you are faced with data that has many missing values. One way to address the missing values is

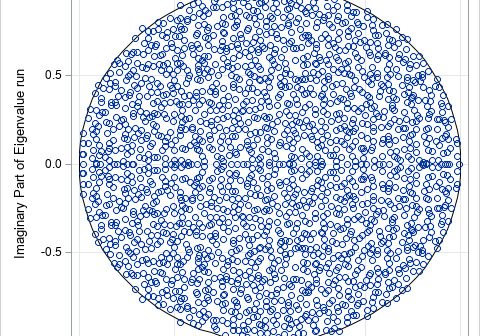
I've previously written about how to generate points that are uniformly distributed in the unit disk. A seemingly unrelated topic is the distribution of eigenvalues (in the complex plane) of various kinds of random matrices. However, I recently learned that these topics are somewhat related! A mathematical result called the
