The DO Loop
Statistical programming in SAS with an emphasis on SAS/IML programs
Sorting is a fundamental operation in statistical programming, and most SAS programmers are familiar with PROC SORT for sorting data sets. But did you know that you can also sort rows of a SAS/IML matrix according to the value of one or more columns? This post shows how. Sorting a
In my spare time, I enjoy browsing the StackOverflow discussion forum to see what questions people are asking about SAS, SAS/IML, and statistics. Last week, a statistics student asked for help with the following homework problem: I need to generate a one-dimensional random walk in which the step length and
Several times a year, I am contacted by a SAS account manager who tells me that a customer has asked whether it is possible to convert a MATLAB program to the SAS/IML language. Often the customer has an existing MATLAB program and wants to include the computation as part of
String comparisons in SAS software are case-sensitive. For example, the uppercase letter "F" and lowercase letter "f" are treated as unique characters. When these two letters represent the same condition (for example, a female patient), the strings need to be handled in a case-insensitive manner, and a SAS programmer might
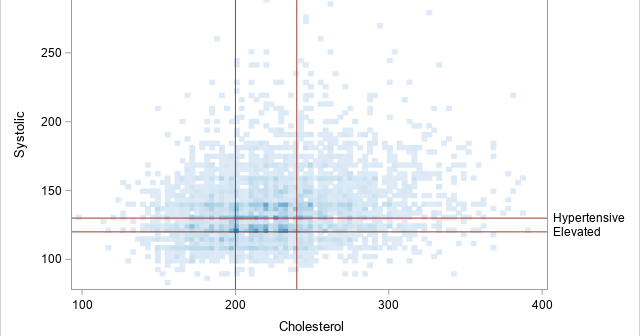
Do you have many points in your scatter plots that overlap each other? If so, your graph exhibits overplotting. Overplotting occurs when many points have similar coordinates. For example, the following scatter plot (which is produced by using the ODS statistical graphics procedure, SGPLOT) displays 12,000 points, many of which
I don't use the SAS macro language very often. Because the SAS/IML language has statements for looping and evaluating expressions, I rarely write a macro function as part of a SAS/IML programs. Oh, sure, I use the %LET statement to define global constants, but I seldom use the %DO and