The DO Loop
Statistical programming in SAS with an emphasis on SAS/IML programs
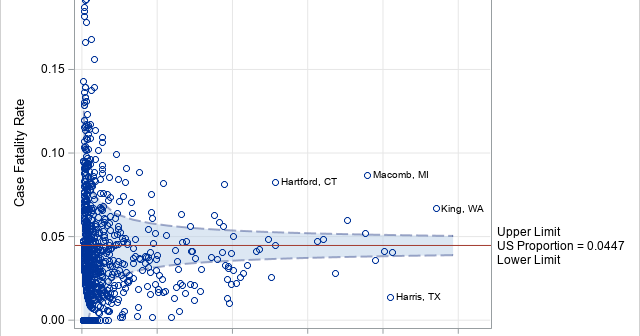
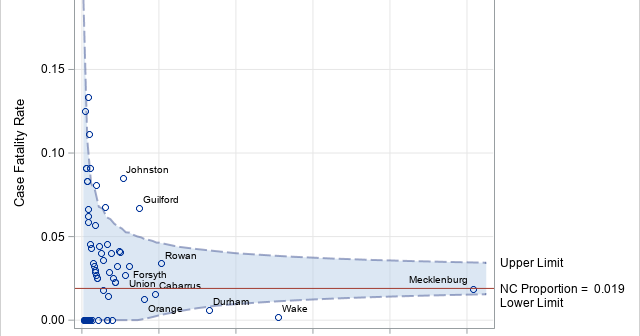
A previous article describes the funnel plot (Spiegelhalter, 2005), which can identify samples that have rates or proportions that are much different than expected. The funnel plot is a scatter plot that plots the sample proportion of some quantity against the size of the sample. The variance of the sample

Death is always a difficult topic to discuss, and death has been in the news a lot during this tragic coronavirus pandemic. Many news stories focus on states, counties, or cities that have the most cases or the most deaths. A related statistic is the case fatality rate, which is

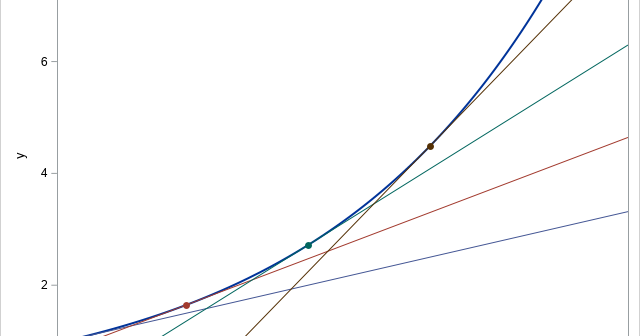
I previously wrote about the advantages of adding horizontal and vertical reference lines to a graph. You can also add a diagonal reference line to a graph. The SGPLOT procedure in SAS supports two primary ways to add a diagonal reference line: The LINEPARM statement enables you to specify a
