The DO Loop
Statistical programming in SAS with an emphasis on SAS/IML programs
This article shows how to use SAS to implement the ISO algorithm to generate (and validate) a Universal Loan Identifier (ULI). A ULI is a long string of numbers and letters that serves as a unique identifier that is used for certain financial transactions. The ISO standard ensures that banks

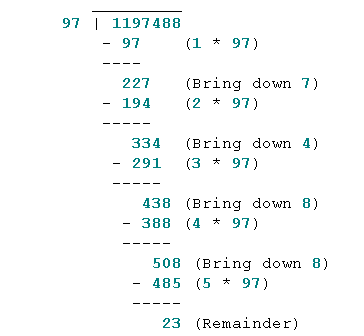
On social media, a SAS user reported that SAS could not compute the modulo of an extremely large integer. In SAS, the modulo operation is usually performed by using the MOD function, which computes the remainder of dividing an integer, N, by another integer, d. (In symbols, the remainder is

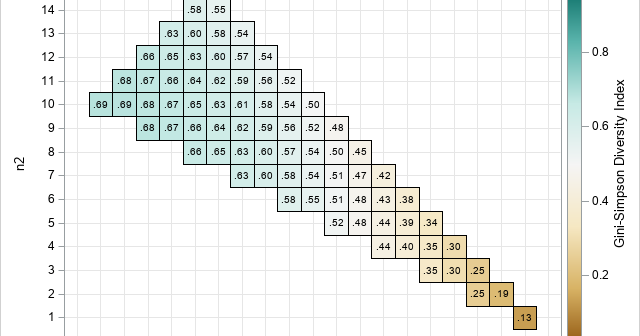
A previous article discusses the Gini-Simpson diversity index and how to compute it in SAS. Suppose you have a sample that contains R classes. (Classes are also called groups or categories.) Intuitively, the sample exhibits "high diversity" if the class sizes are approximately equal. The sample shows "low diversity" if
