The DO Loop
Statistical programming in SAS with an emphasis on SAS/IML programs
To get better at something, you need to practice. That maxim applies to sports, music, and programming. If you want to be a better programmer, you need to write many programs. This article provides an example of forming the intersection of items in a SAS/IML list. It then provides several

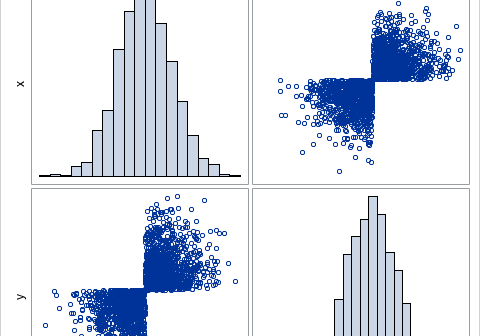
After my recent articles on simulating data by using copulas, many readers commented about the power of copulas. Yes, they are powerful, and the geometry of copulas is beautiful. However, it is important to be aware of the limitations of copulas. This article creates a bizarre example of bivariate data,

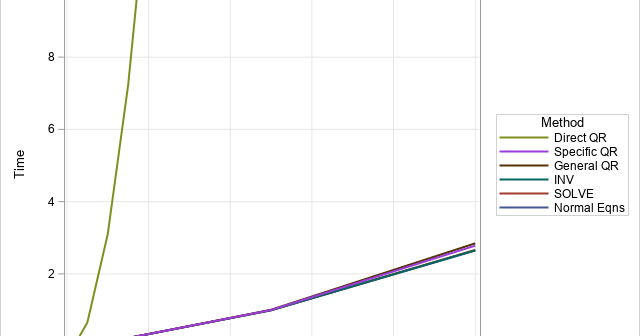
In a previous article, I discussed various ways to solve a least-square linear regression model. I discussed the SWEEP operator (used by many SAS regression routines), the LU-based methods (SOLVE and INV in SAS/IML), and the QR decomposition (CALL QR in SAS/IML). Each method computes the estimates for the regression
