Programming Tips

Strengthen your programming skills with tips and techniques from the experts
Data Visualization | Learn SAS | Programming Tips
Sanjay Matange 0
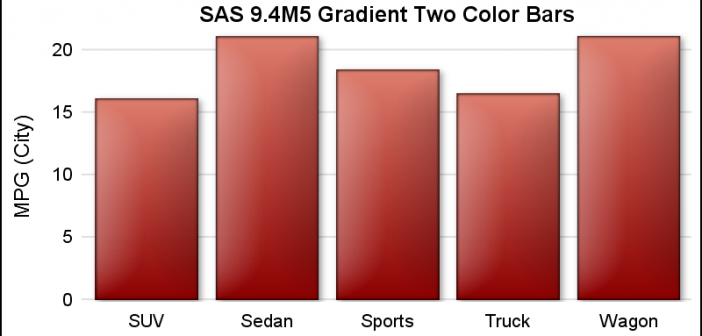
New Features in SAS 9.40M5 - Gradient fills

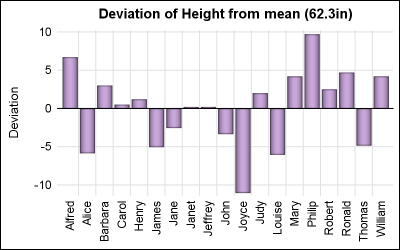
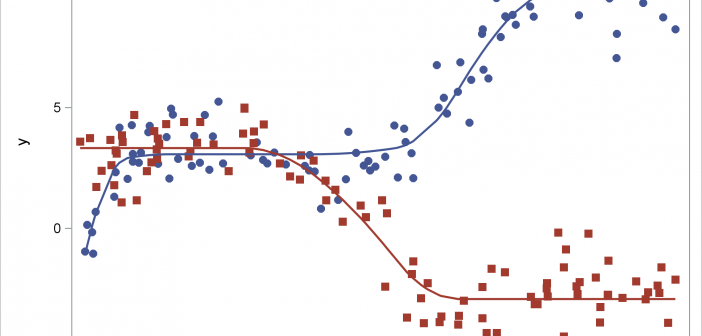
ODS Graphics procedures primarily strive towards the following goal:  "Make simple graphs easy and complex graphs possible".   SGPLOT procedure allows you create simple graphs with a single plot statement, and create complex graphs by layering together or combining multiple plot statements.  Generally, the appearance follows the guidelines set by industry

Data Visualization | Learn SAS | Programming Tips
Sanjay Matange 2
New features with SAS 9.40 M5

SAS 9.4 maintenance release 5 was released on Sept 19, 2017.  This release includes many new items including integration with SAS Viya and SAS Studio, a web application for SAS development.  Also Included with this release are some cool new features in the graphics domain, some of which were requested

Analytics | Data Visualization | Learn SAS | Programming Tips
Sanjay Matange 0
Getting started with SGPLOT - Part 8 - Horizontal HighLow Plot

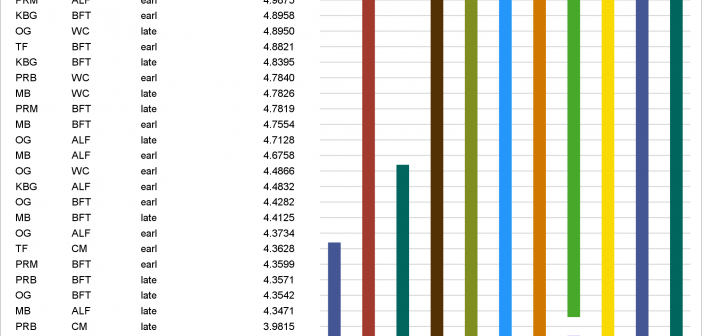
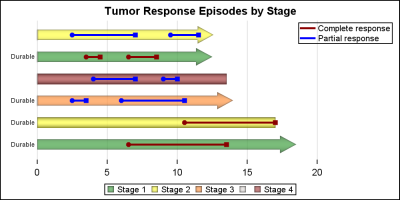
On a recent visit to an In-House Users Group meeting at a Pharmaceutical company, I presented a 1/2 day seminar on creating Clinical Graphs using SG Procedures.  Polling the audience for their experience with these procedures indicated that many SAS users are not familiar with these new ways to create graphs. So,

Data Visualization | Programming Tips
Warren F. Kuhfeld 0
Advanced ODS Graphics: Examining and processing templates

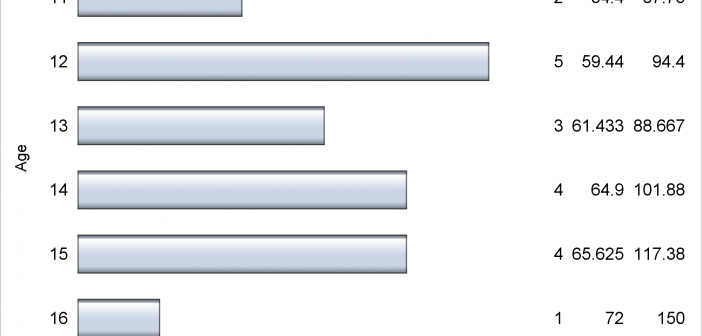
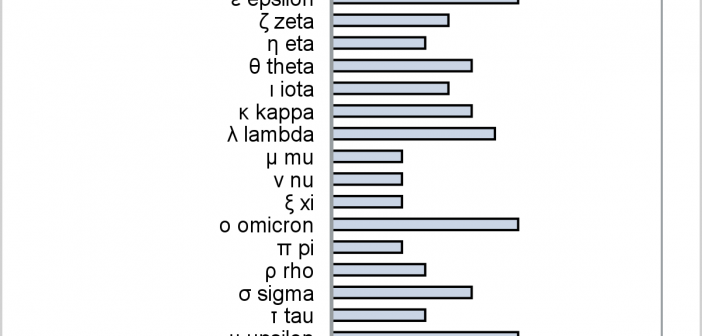
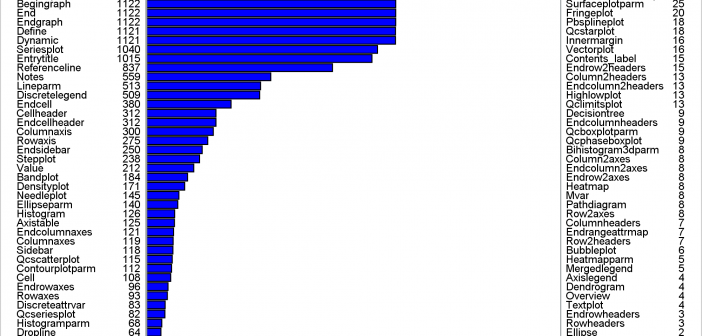
This post shows a variety of techniques including how to use PROC TEMPLATE and the SOURCE statement, PROC SGPLOT with multiple Y-axis tables, create comparable axes in two side-by-side graphs, create a broken axis, write and use a table template that wraps text, and find and display examples of certain statements in graph templates and fonts in style templates.

1 16 17 18 19 20 21

Back to Top