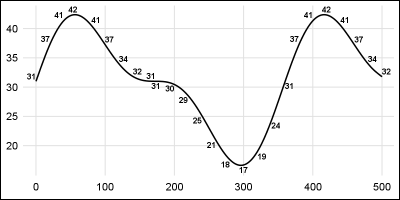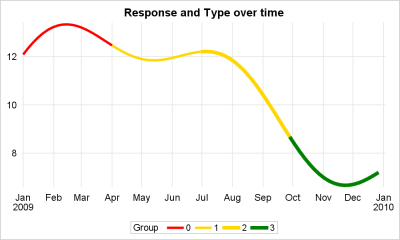
This article is motivated by a recent question on the SAS Communities board. This user wants to create a series or spline plot where the attributes of the line (color, thickness) can be changed based on another variable. In this case it may be a binary variable with "0" and
Author
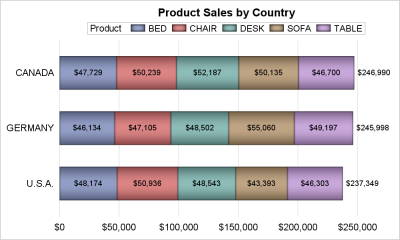
A common request on the communities page is to place data labels on horizontal bar charts. Often users want to display stacked horizontal bar charts, with the values displayed for each segment and the overall value of the bar itself as shown in the example below. In this example, the
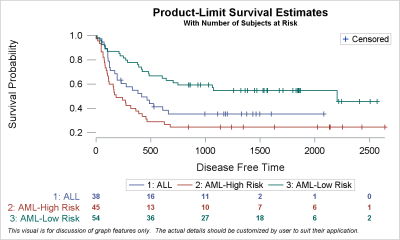
Survival plots are automatically created by the LIFETEST procedure. These graphs are most often customized to fit the needs of SAS users. One way to create the customized survival plot is to save the generated data from the LIFETEST procedure, and then use the SGPLOT procedure to create your custom
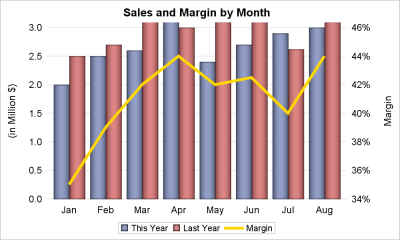
A dual response axis chart is useful when the data type for the multiple measures are not compatible. For example, when overlaying measures like "This Year" sales with "Last Year" sales, the format and magnitudes of the two measures (or values for two groups) may be compatible, and it is
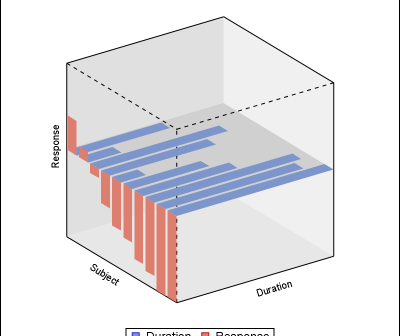
A few months ago, a user inquired about a chart that showed tumor response and treatment duration for each subject on 2 different planes of a 3D view. The data was really 2D, with one independent variable (the subject id) and two or more response values. I had provided an
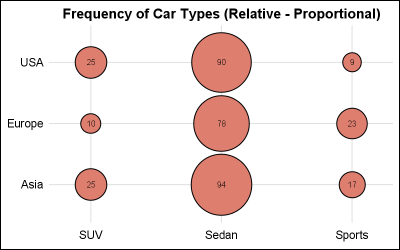
This is the 9th installment of the "Getting Started" series, and the audience is the user who is new to the SG Procedures. It is quite possible that an experienced users may also find some useful nuggets here. In this article, we will cover the basics of the BUBBLE plot.
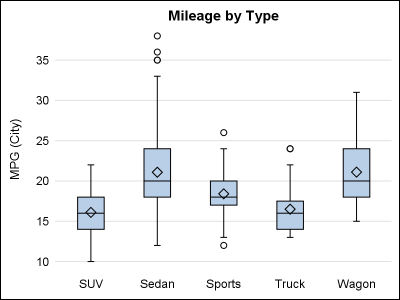
In my previous post, I described a new options to control the widths of the caps for Whiskers, Error and Limit bars. This topic could have been titled "Little things go a long way", as such details really make for a good graph. In a similar manner, another detail issue
The SG procedures and GTL statements do a lot of work for us to display the data using the specified statements. This includes setting many details such as arrow heads, line patterns etc, including caps. Often, such details have a fixed design according to what seems reasonable for most use
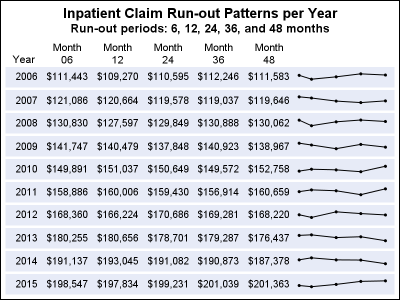
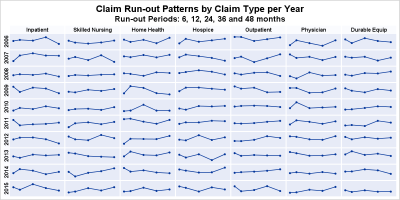
In the previous post, I discussed creating a 2D grid of spark lines by Year and Claim Type. This graph was presented in the SESUG conference held last week on SAS campus in the paper ""Methods for creating Sparklines using SAS" by Rick Andrews. This grid of sparklines was actually the
The 25th annual SESUG conference was held at in the SAS campus this week. I had the opportunity to meet and chat with many users and attend many excellent presentations. I will write about those that stood out (graphically) in my view. One excellent presentation was on "Methods for creating