In my previous post, I described a new options to control the widths of the caps for Whiskers, Error and Limit bars. This topic could have been titled "Little things go a long way", as such details really make for a good graph.
In a similar manner, another detail issue is the positioning of text values around the (x, y) location. When using the TEXT statement, by default, the text label is placed at the specified (x, y) value. Here is a sample program with the resulting graph.
proc sgplot data=spaghetti noborder noautolegend;
spline x=x y=y / lineattrs=(thickness=2);
text x=x y=y text=ylbl / textattrs=(weight=bold);
xaxis display=(noline noticks nolabel) grid;
yaxis display=(noline noticks nolabel) grid;
run;
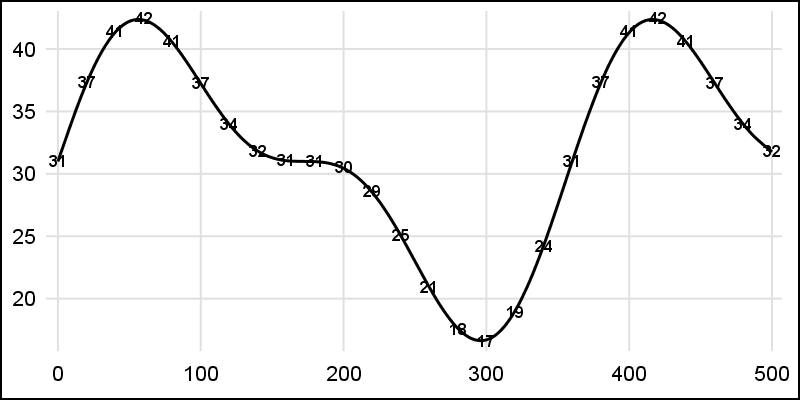
Note, the text labels are drawn positioned at the center of the (x, y) location. We probably don't want the values exactly on the curve, so, we can use the POSITION option to place the labels offset to one side using the option POSITION=top.
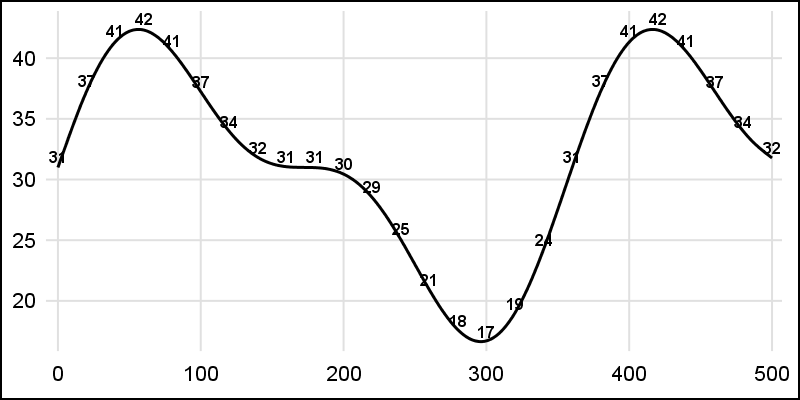
Now, all the values are moved up, so the text label is placed above the (x, y) location. This is better, but still this works better for some values than others. It would be nice to be able to set the placement based on the slope or curvature of the line or some user preferred way.
With SAS 9.40M5, the POSITION option now supports a variable. The variable can contain the keyword like "top", "bottomright" and so on to specify the position of each value. Using POSITION=pos, we get the graph below. The position is provided by the user based on their own criteria.
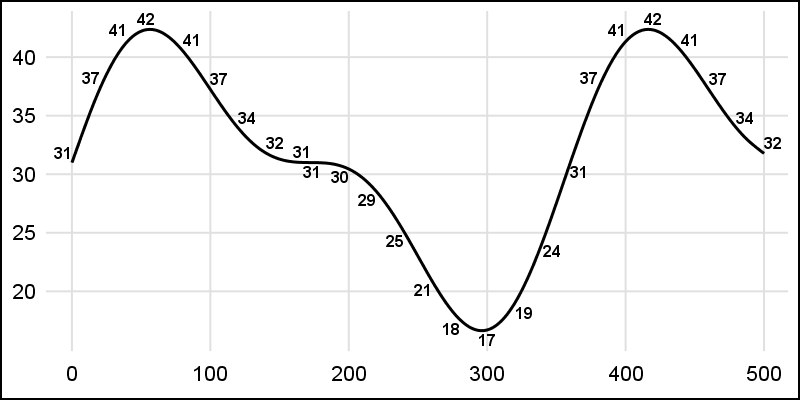
Now, the position for each individual label is specified in the variable "Pos" in the data. So, now, we can place some text labels below the (x, y) value, and some above, or towards topleft as desired by the programmer. This results in a much nicer placement of the labels. Little things really do go a long way.
SAS 9.40M5 SGPLOT Code: Text_Position

2 Comments
Hello,
I see that TEXTPLOT is deprecated. What do you suggestion to accomplish the same task as above?
Best,
Robert
TEXTPLOT is a statement that is supported in GTL. The SGPLOT "friendlier" statement that simplifies the coding is in the TEXT statement.