All Posts


We continue my colleague Udo Sglavo's example with the SAS code for incorporating R models into SAS Forecast Server: Code for Including R Model Results in SAS As a first step I’m exporting a data set containing one time series from SAS to R (actually I will use the same


In 2009, SAFETEA-LU—the legislation that outlines federal transportation funding for the states—expired. Since then, members of Congress have been kicking the can down the road, passing funding extensions instead of passing legislation. The major impact of this failure to act is that the U.S. continues to slip further and further
My colleague Udo Sglavo is back, responding to comments on his guest blog from two weeks ago. For fans of SAS and R, he shows how to incorporate results from Hyndman's R model into SAS. Do the Evolution After publishing my blog on replicating Rob J Hyndman’s cross validation idea
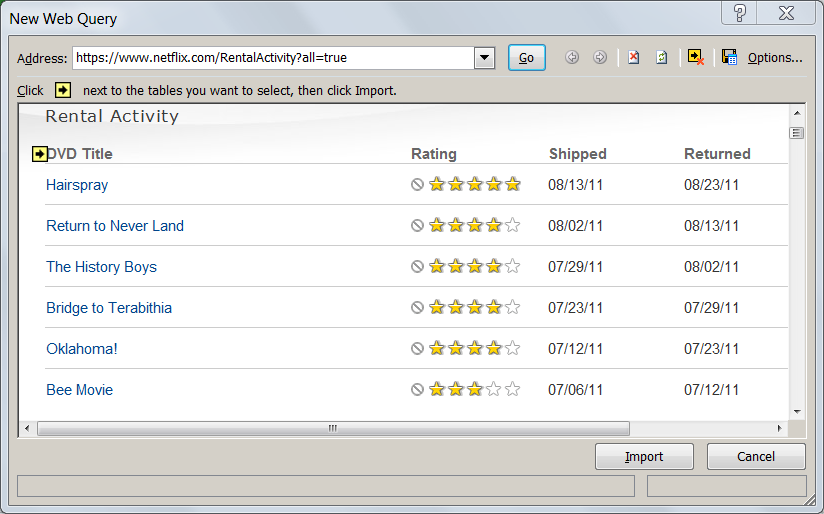

Like millions of other Americans, I recently was asked to make a decision of tremendous importance to my household -- a decision that would affect the welfare of everyone in my family. That decision, of course, was whether to continue to receive Netflix movies by mail, or opt for the
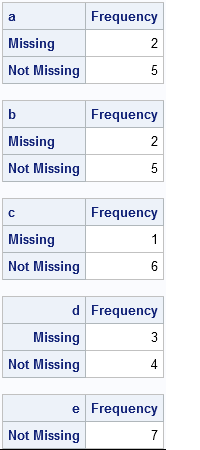

The other day I encountered a SAS Knowledge Base article that shows how to count the number of missing and nonmissing values for each variable in a data set. However, the code is a complicated macro that is difficult for a beginning SAS programmer to understand. (Well, it was hard


As schools across the country delve into a new year, I want to bring my readers back to teaching basics with Part 2 of my Three R’s series on Rigor, Relevance, and Relationships. Here's Part 1. As students flood our halls and classrooms, are they eager and excited for the challenging year ahead? Do


Metadata is data about data. For the purposes of his NESUG 2011 presentation, Frank DiIorio defined metadata more precisely as data about data and data that describes workflow objects and processes. DiIorio wrote his paper because organizations are challenged more and more today to do more with less. Metadata can
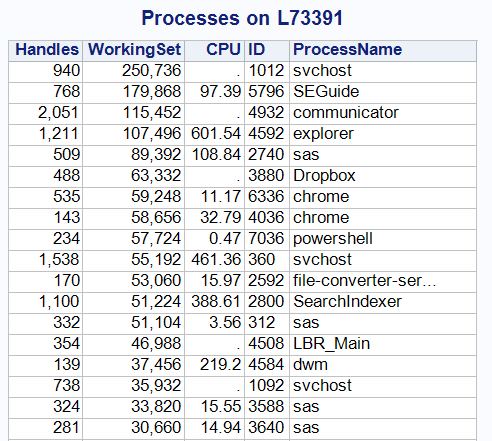
As I mentioned in my introductory post about Windows PowerShell, you can use PowerShell commands as a simple and concise method to collect data from your Windows systems -- information that is ripe for analysis within SAS. In this example, I'll show a technique for using a SAS program to
Look at the following graphs showing one weekly time series. The left hand shows the actual time series plot. To the less statistically inclined this plot might indicate that the data is seasonal due to the troughs during summer and the peaks during winter. However, if you were to use
In this guest blog, my colleague Snurre Jensen (Analytic Solutions Manager, SAS EMEA Technology Practice) discusses a fine point regarding the word “seasonality” in time series forecasting. When we see general ups and downs in the data that tend to repeat year after year, we commonly refer to this as
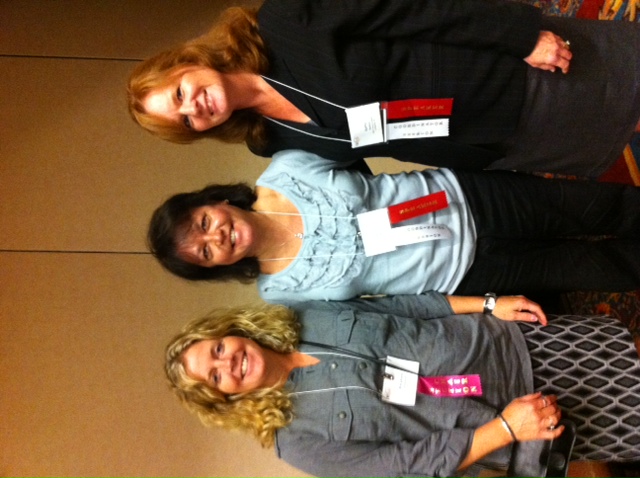
Kathleen Harkins, Carolyn Maass and Mary Anne Rutkowski, from Merck Sharp and Dohme, collaborated to write T.I.P.S: Techniques and information for programming in SAS® for NESUG 2011. These three women are highly experienced programmers: Harkins has more than 20 years of experience in the pharmaceutical and aerospace industries; Maass has

The downturn in the economy beginning in 2008 and continuing even to now has put tremendous pressure on local governments to do “less with less”. In the past when economic downturns caused service level cut backs the cry was to do “more with less”. The idea was to identify ways

I use Google Reader to keep up with SAS-related conversations on the blogosphere. I thought it would be nice to share the lists of blogs that I follow as "shared bundles". If you also use Google Reader, it will be very easy for you to add these bundles to

‘Context’ defined (as cited from the Merriam-Webster Online Dictionary): 1: the parts of a discourse that surround a word or passage and can throw light on its meaning; and, 2: the interrelated conditions in which something exists or occurs: environment, setting. While context is clearly important, today it is consistently
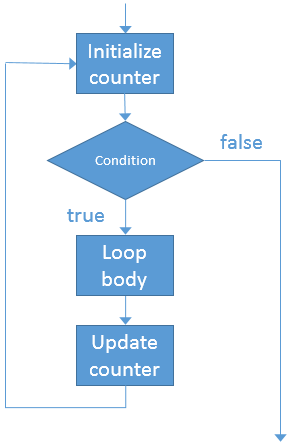
Looping is essential to statistical programming. Whether you need to iterate over parameters in an algorithm or indices in an array, a loop is often one of the first programming constructs that a beginning programmer learns. Today is the first anniversary of this blog, which is named The DO Loop,