All Posts


AnnMaria wrote her latest blog post, "SAS Enterprise Guide makes you smarter", partly in response to my recent post about whether it's making you stupider. From the contents of her program example, I'm guessing that she's preparing for WUSS in November. I don't get to attend this year, but my
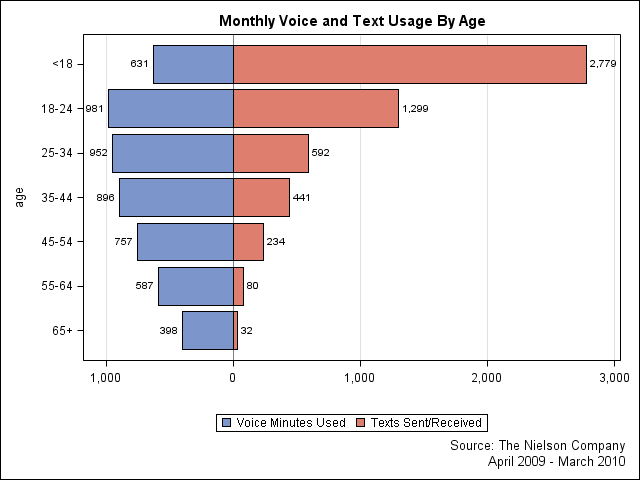

The Junk Chart blog discusses a potential problem that can arise in grouped bar charts when the two groups have vastly different ranges. One possible solution (which is discussed at the Junk Chart sister blog, Numbers Rule Your World) is to present the data back-back in what is sometimes called


We have all heard the old axiom that all politics are local. Recently, I have been in discussions about international responses to major disasters, Specifically, the floods in Pakistan, Haitian earthquake and Indonesia tsunami of 2004. In each of those cases, there were massive international responses to the crisis. Numerous
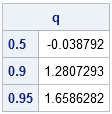
The SAS/IML run-time library contains hundreds of functions and subroutines that you can call to perform statistical analysis. There are also many functions in Base SAS software that you can call from SAS/IML programs. However, one day you might need to compute some quantity for which there is no prewritten

Visualizing the distribution of data is a primary task of data analysis. With all the hurricane activity in the Atlantic this year, I’ve been thinking about ways to visualize the historical distribution of hurricane activity. USA Today on Friday, August 13, 2010, announced that "the heart of hurricane season is

Recently, SAS Global Forum announced the call for papers for the 2011 conference to be held at Caesars Palace in Las Vegas. Since the conference is in Las Vegas, I’ve been thinking a lot about games of chance: blackjack, craps, roulette, and the like. You can analyze these games by
My mother taught me to put things away when I'm finished using them. She doesn't use a computer, but if she did, I know that she'd approve of this tip from my book: Tip: Always close your files and data sets when you are finished reading or writing them. In
Today is the birthday of Bernhard Riemann, a German mathematician who made fundamental contributions to the fields of geometry, analysis, and number theory. Riemann is definitely on my list of the greatest mathematicians of all time, and his conjecture about the distribution of prime numbers is one of the great
In my post yesterday about the 64-bit hype and how client apps like SAS Enterprise Guide would see only a limited boost from a 64-bit version, I forgot to point out another offering from SAS that has embraced the 64-bit architecture: JMP. JMP offers a 64-bit version, and it makes

Question: Is there a 64-bit version of SAS Enterprise Guide? Answer: SAS Enterprise Guide is a 32-bit application, even with its most recent release. As such, it is still completely supported on any 64-bit Windows machine, but it runs in the 32-bit subsystem (also known as WoW64 – short for

Missing values are a fact of life. Many statistical analyses, such as regression, exclude observations that contain missing values prior to forming matrix equations that are used in the analysis. This post shows how to find rows of a data matrix that contain missing values and how to remove those

Have you ever visited a city for the first time and, instead of relying maps to plan your journey, you simply plug your destinations into a GPS device and mindlessly follow the navigation directions? You've just cheated yourself out of a learning opportunity, because planning the journey and using your

Peter Flom reminded readers of his blog that you should always end a SAS procedure with a RUN statement. This is good rule. However, PROC IML is an exception to the rule. In PROC IML, the RUN statement is used to execute a built-in subroutine or a user-defined module. You


The shortfall in 2010 state and local government budgets is not news. But it remains the biggest issue facing state and local governments today – and will continue well into tomorrow. Existing gaps are projected to widen further in 2011, throwing departments and agencies already on the edge further into
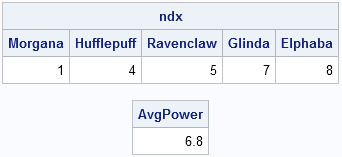
A frequently performed task in data analysis is identifying all the observations in a data set that satisfy certain conditions. For example, you might want to identify all of the female patients in your study or to identify all patients whose systolic blood pressure is greater than 140 mm Hg.