All Posts
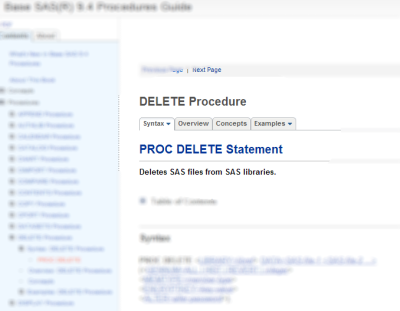

The DELETE procedure is probably the most well-known and most-used SAS procedure that isn't actually documented or officially supported. That is, that was the case before the release of SAS 9.4, when PROC DELETE returns with more features than ever -- including a production-quality status. In his SAS Global Forum

Tried, tested and true -- I’m sure you already practice some, if not all, of these efficient techniques to save resources. I recently shared these 10 techniques with the Wisconsin Illinois SAS users group in Milwaukee. The conference ran smoothly under the incredibly able guidance of Dr. LeRoy Bessler. I’ll


Four authors. Four papers. One set of data. The month of August and the 2014 Call for Content are just around the corner, and this seems like a good time to share a little inspiration and innovation. The Foundations and Fundamentals paper section at SAS Global Forum 2013 featured a four-part
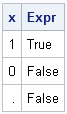

Every programming language has an IF-THEN statement that branches according to whether a Boolean expression is true or false. In SAS, the IF-THEN (or IF-THEN/ELSE) statement evaluates an expression and braches according to whether the expression is nonzero (true) or zero (false). The basic syntax is if numeric-expression then do-computation;


Conventional or Organic? That is the question. Research varies about whether organic foods are healthier than conventional foods. However, one of the biggest arguments for buying organic is in regards to pesticide exposure. Convincing evidence is revealing that the pesticides we eat, drink and inhale are stored in our bodies

On the Web site for the book Statistical Programming with SAS/IML Software, I provide instructions on how to download the sample data sets and install them so that they can be used from within SAS/IML Studio. When I wrote the book I did not anticipate that SAS users might want
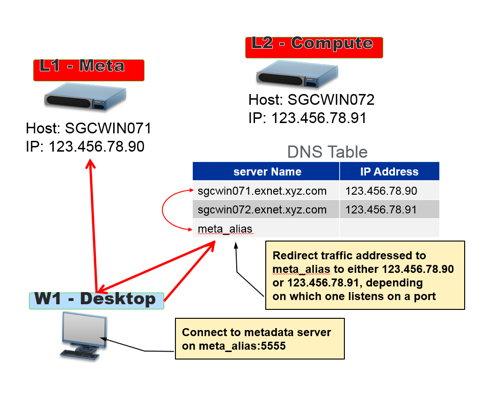

In my last post, I introduced the hardware solutions (such as a virtual IP switch or IP load balancer) that enable client applications to access services regardless of whether they are running on a primary or a failover server in a grid-enabled environment configured with high availability. In this post,

When I work on SAS projects that create lots of files as results, it's often a requirement that those files be organized in a certain folder structure. The exact structure depends on the project, but here's an example: /results |__ html |__ images |__ xls |__ data Before you can
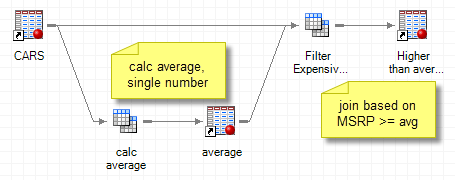
Many SAS Enterprise Guide users practically live in the Query Builder. For those who understand their data tables, the Query Builder provides a tremendous amount of flexibility to pull and manipulate data. The Query Builder produces SQL programs behind the scenes, which translates well for database-centric work. Sometimes a complex


This question comes up often when we’re working with SAS customers to configure their underlying storage arrays: “When is solid-state storage appropriate for SAS applications?” Solid-state drives, or SSDs, are the latest and greatest thing in storage today because they boast extremely fast performance. In this post, I’ll outline how

Recently a user chimed in on the SAS Communities page, requesting a way to add some observation level annotation to a box plot. Wendy was delighted to see a graph created by the UNIVARIATE procedure called "Schematic Plot". In this graph, the box plot of the analysis variable is shown with


Every programmer may dread the thought of a colleague peeking over his or her shoulder, double-checking code, but SAS Global Forum paper winner David Scocca has offered his tips for making code reviews a painless process. His paper, Communicating Standards: A Code Review Experience, is a must-read. Here’s a peek

How do you count the number of unique rows in a matrix? The simplest algorithm is to sort the data and then iterate down the rows, comparing each row with the previous row. However, this algorithm has two shortcomings: it physically sorts the data (which means that the original locations

If you routinely import data from external sources, chances are you’ve learned the value in having a systematic import process. In this post, I will begin sharing my approach of using metadata tables to guide the importing of data.

Based on my previous posts, we are almost done with the basics of SAS libraries and how the various clients can access them. Before we leave this topic and go onto third-party database engines, I wanted to spend a few minutes talking about some best practices for making sure that