All Posts


In a comment on last week’s blog asking SAS administrators: please submit your paper idea for SAS Global Forum 2015, Andrew Howell of ANJ Solutions asked if I had any statistics on which were the most popular SAS administrator papers for last year’s conference. He suggested the following nominations although


If you’re anything like me, you are busy. Busy at work, busy at home, busy on the so-called weekend. It never stops. Even as a fitness professionals, my husband and I are right there with you in the constant struggle to find time to exercise and eat healthfully. Here are
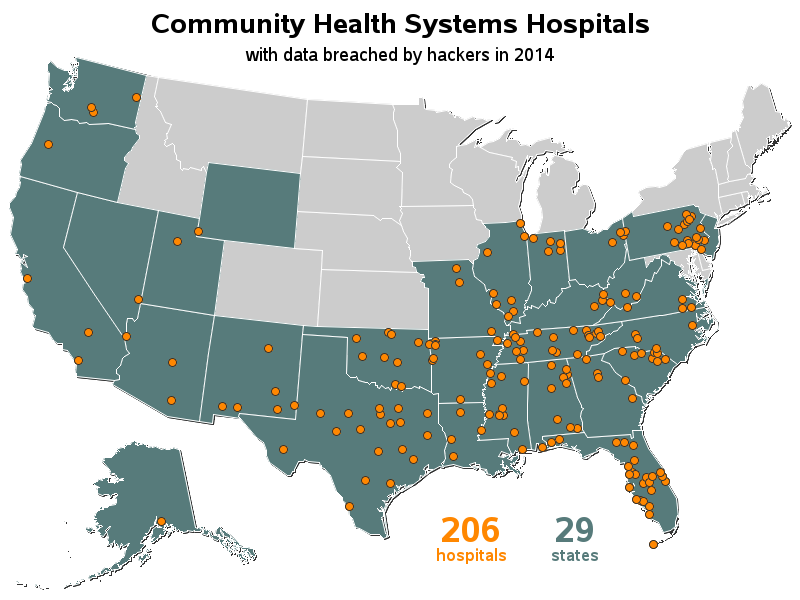

If you're a really big company, with many locations around the country, how do you keep track of all that? ... With a great map, of course! I recently read a CNN article about the Community Health Systems network being hacked - exposing the names, Social Security numbers, physical addresses, birthdays
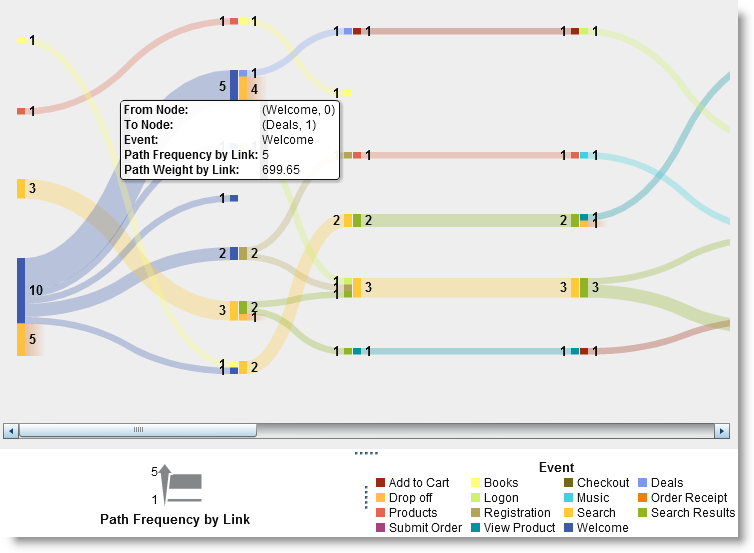

Introduction Understanding the behavior of your customers is key to improving and maintaining revenue streams. It is a an important part when crafting successful marketing campaigns. With SAS Visual Analytics 7.1 you can analyze, explore and visualize user behavior, click paths and other event-based scenarios. Monitoring the customer journey by visualizing

Often there are questions from users on creating histogram using a Log X axis. One such question came up this weekend, where a user wanted a histogram of her data using log axis. Before we get into her specific case, let us first clarify what we may want to see

Before I started my internship with SAS, my only experience with data or analysis came from an “Introduction to Statistics” course I took freshman year to satisfy my math requirement. If I’d known then that statistics and knowing SAS programming would be the #1 skill for a bigger paycheck, or
In her article Creating Spaghetti Plots Just got Easy, Lelia McConnell has provided us a glimpse into some new useful features in the SAS 9.4M2 release. The term Spaghetti plots generally refers to cases where time series plots have to be identified by multiple group classifications. The support for the


Are there times when you need to pass special characters to a macro variable but cannot find the right technique to accomplish the task? In this article I’ll discuss the different macro quoting functions and give a simple technique to help you determine which macro quoting function to use. Why

Find out which state you'll live in, if the US state borders are redrawn so we have 50 states with equal population! (Don't worry! - This is just a fun/hypothetical "what if" blog!) To get you in the mood for this topic, here's a picture of one of the many
The SAS Global Forum 2015 Call for Papers opened the end of last month! I cannot believe it is time to start getting ready for the conference that will be in Dallas, TX on April 26-29, 2015. As part of the group from SAS who goes to the conference each


Ahhh, summer!! It’s such a beautiful time of year. All the fresh produce comes out of the fields at a rapid pace giving us an abundance of deliciousness and beautiful colors to thrill our bodies and souls.
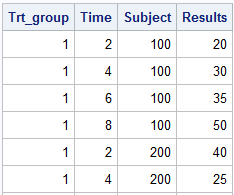
This article is by guest contributor Lelia McConnell, SAS Tech Support. Creating Spaghetti Plots Just Got Easy Sample 38076: “Response by patient and treatment group” illustrates how to generate a spaghetti plot using the SGPLOT procedure. Sample 40255: “Plot of study results by treatment group” illustrates how to generate a
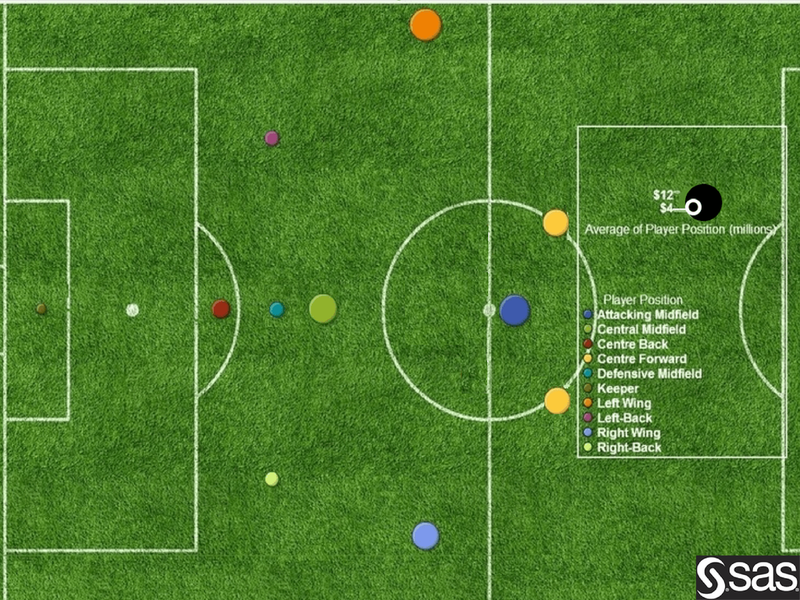
After the 2014 FIFA World Cup, one thing’s clear: here at SAS, we love football (soccer in the US!). To wrap up the popular 2014 World Cup data visualization series on the SAS Visual Analytics Community, we created a presentation that’s chocked-full of interesting insights. From the trillions of pieces


I’m sitting here staring at a book on my shelf entitled, “Impending Crisis”. Even knowing the copyright date, 2003, it could still be about any one of several possible crises: healthcare, financial, energy, education, environment. But no, in this case the impending crisis in question is provided by the subtitle: “Too many jobs,

This fall, you’ll be swept off your feet in the Windy City: The 2014 Midwest SAS User’s Group (MWSUG) takes place in Chicago from October 5-7. With 135 presentations in 11 different sections, you’ll have the chance to expand your SAS know-how and network with fellow SAS professionals.