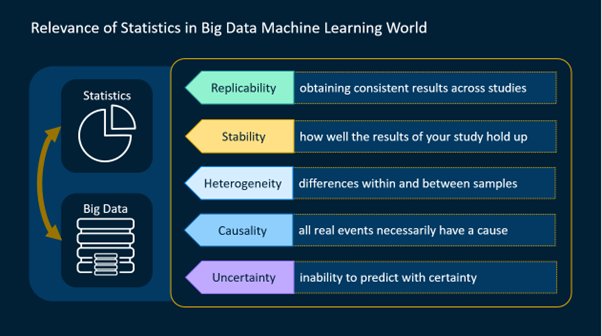
Developing an accurate understanding of statistics will help you build robust machine learning models that are optimized for a given business problem. SAS launched a new course that provides a comprehensive overview of the fundamentals of statistics that you'll need to start your data science journey. This course is also a prerequisite to many courses in the SAS data science curriculum.
Tag: statistics
When you use PROC MEANS or PROC SUMMARY to create a summary data set and include a CLASS statement, SAS includes two variables, _FREQ_ and _TYPE_, in the output data set. This blog shows you two ways to interpret and use _TYPE_ using the data set Shoes in the SASHELP
Because it is near the end of the year, I thought a blog about "Summarizing" data might be in order. For these examples, I am going to use a simulated data set called Drug_Study, containing some categorical and numerical variables. For those interested readers, the SAS code that I used
The following is an excerpt from Cautionary Tales in Designed Experiments by David Salsburg. This book is available to download for free from SAS Press. The book aims to explain statistical design of experiments (DOE) to readers with minimal mathematical knowledge and skills. In this excerpt, you will learn about
Learn how to use the SGPLOT procedure for graphical representation when you perform statistical analysis for a quadratic ANCOVA model with the GLM procedure.
One of the first and most important steps in analyzing data, whether for descriptive or inferential statistical tasks, is to check for possible errors in your data. In my book, Cody's Data Cleaning Techniques Using SAS, Third Edition, I describe a macro called %Auto_Outliers. This macro allows you to search
The t-test is a very useful test that compares one variable (perhaps blood pressure) between two groups. T-tests are called t-tests because the test results are all based on t-values. T-values are an example of what statisticians call test statistics. A test statistic is a standardized value that is calculated
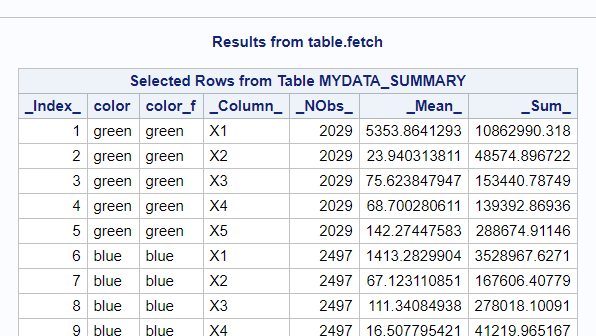
Summarizing numeric data is an important step in analyzing your data. CASL provides multiple actions that generate summary statistics. This blog provides a quick overview of three of those actions: SIMPLE.SUMMARY, AGGREGATION.AGGREGATE, and DATAPREPROCESS.RUSTATS.
One question I get asked a lot is: What is the most exciting new statistical feature in the 14.1 release? And they get a bit frustrated when I say: It depends. But it does depend! SAS statistical software provides a broad array of capabilities that help users track disease outbreaks,
It’s an understatement to say there are many Base SAS procedures! Some procedures may be used for basic report writing. Other procedures may be used to perform statistical analysis. Some have similar functions. Others are unique in the output that they can produce. Which procedure you choose generally depends on