When you use PROC MEANS or PROC SUMMARY to create a summary data set and include a CLASS statement, SAS includes two variables, _FREQ_ and _TYPE_, in the output data set.
This blog shows you two ways to interpret and use _TYPE_ using the data set Shoes in the SASHELP library.
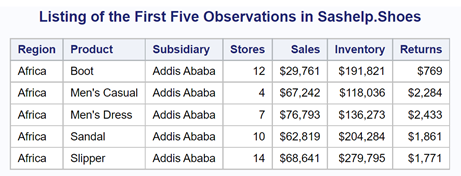
Here is a listing showing the first five observations in this data set:
Because there are many regions and products, we are going to include a filter (WHERE statement) to restrict the number of Regions and Products. The first program looks at the sum of Sales for each Region.
title "Using a Single CLASS Variable"; proc means data=Sashelp.Shoes noprint; where Region in ('Asia','United States') and Product in ('Boot','Sport Shoe','Sandle'); class Region; var Sales; output out=Summary_Region n= sum= / autoname; run; |
The option NOPRINT suppresses the printed output (remember we are creating a summary data set). The WHERE statement is selecting two Regions and three Products. The AUTONAME option in the OUTPUT statement automatically names the variables in the output data set. It uses the variable name(s) in the VAR statement, adds an underscore, followed by the name of the statistic. Here is the output:
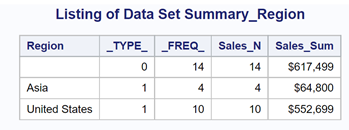
The variable named Sales_Sum is the sum of the variable Sales and is given this name because of the AUTONAME option mentioned above. The first observation in the output data set shows the sum of sales for all Regions and the value of _TYPE_ is 0. The second and third observations are the sum of Sales for each Region and _TYPE_ has a value of 1. We will get into a detailed discussion of the _TYPE_ variable in the next example where we use two CLASS variables.
This next example uses two CLASS variables—Region and Product.
title "Using Two CLASS Variables"; proc means data=Sashelp.Shoes noprint; where Region in ('Asia','United States') and Product in ('Boot','Sport Shoe','Sandle'); class Region Product; var Sales; output out=Summary_Region_Product n= sum= / autoname; run; |
The listing is shown below:

Notice that there are now four values for the variable _TYPE_. _Type_ 0 is the sum of Sales for all Regions and all Products; _TYPE_ 1 is the sum of sales for each Product; _TYPE_ 2 is the sum of sales for each Region; and finally, _TYPE_ 3 is the sum of sales for each Region and Product. There is a somewhat complicated way to know what each value of _TYPE_ describes. Rather than go through that explanation, we are going to add the option CHARTYPE to PROC MEANS, making the explanation much simpler. Now let’s run the program above, but add the PROC MEANS option CHARTYPE as shown below.
title "Using Two CLASS Variables"; title2 "Adding the Option CHARTYPE"; proc means data=Sashelp.Shoes noprint chartype; where Region in ('Asia','United States') and Product in ('Boot','Sport Shoe','Sandle'); class Region Product; var Sales; output out=Summary_Region_Product n= sum= / autoname; run; |
Here is the output:

_TYPE_ is now a character variable with a string of 0s and 1s replacing the values of 0 to 3 with their binary values. To determine what each value of _TYPE_ describes, list the two CLASS variables and below them, the value of CHARTYPE, like this:
| CLASS Variable | Region | Product | Description |
|---|---|---|---|
| _TYPE_ | 0 | 0 | Sum for all Regions and Products |
| 0 | 1 | Sum for each Product | |
| 1 | 0 | Sum for each Region | |
| 1 | 1 | Sum for each Region and Product |
A 1 under the CLASS variable indicates that the statistic (sums and N in this example) is being computed for each value of that CLASS variable. Thus, _TYPE_ equal to 01 is the sum for each Product; _TYPE_ 10 is the sum for each Region; and _TYPE_ 11 is the sum for each combination of Region and Product.
If you want only the statistics for every combination of the CLASS variables, add the PROC MEAN option NWAY. Here is the result of adding the PROC MEANS option NWAY:
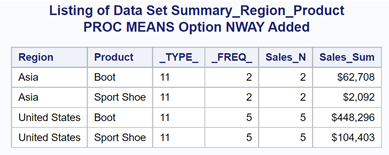
Because you usually want the statistics broken down by each of the CLASS variables, in most cases you will want to include the NWAY option. I like to remember to write NOPRINT and NWAY together so that I don't forget.
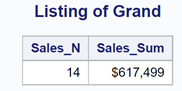
In this last program, I'm going to show you how to use the _TYPE_ variable to create a separate data set for each value of _TYPE_. First, you need to run PROC MEANS without the NWAY option and include the CHARTYPE option. You follow this with a DATA step that create four data sets, each one corresponding to a different value of _TYPE_. Here is the program:
title "Using Two CLASS Variables"; proc means data=Sashelp.Shoes noprint chartype; where Region in ('Asia','United States') and Product in ('Boot','Sport Shoe','Sandle'); class Region Product; var Sales; output out=Summary n= sum= / autoname; run; *Creating seperate data sets for each _TYPE_ value; data Grand(keep=Sales_N Sales_Sum) By_Region(keep=Sales_N Sales_Sum Region) By_Product(keep=Sales_N Sales_Sum Product) Cell_Sums(keep=Sales_N Sales_Sum Region Product); set Summary; if _TYPE_ = '00' then output Grand; else if _TYPE_ = '10' then output By_Region; else if _TYPE_ = '01' then output By_Product; else if _TYPE_ = '11' then output Cell_Sums; run; |
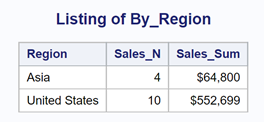
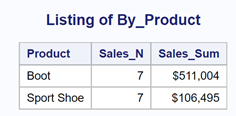
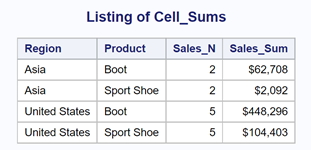
Use a KEEP= data set option to select which variables will be in each data set. For example, the value of Product will be a missing value for each observation in the By_Region data set. Also, the value of Region will be a missing value for each observation in the By_Product data set. The following figures show a listing of the four data sets:
Hopefully, this blog has given you the confidence to use and understand the _TYPE_ variable. If you want to learn more about programming in SAS, check out my book Learning SAS® by Example: A Programmer's Guide, Second Edition.

1 Comment
Great blog! Just one comment - note that you are not getting "Sandal" in the output because it is misspelled as "Sandle" in your WHERE statement.