Because it is near the end of the year, I thought a blog about "Summarizing" data might be in order.
For these examples, I am going to use a simulated data set called Drug_Study, containing some categorical and numerical variables. For those interested readers, the SAS code that I used to generate the data set Drug_Study is shown below. (Please refer to two earlier blogs that describe how to create simulated data sets.)
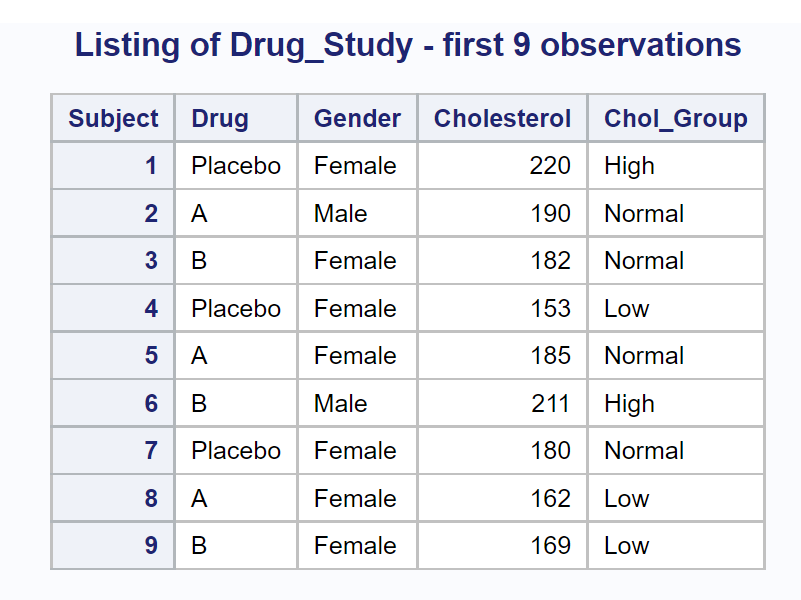
*Program to create data set Drug_Study'; proc format; value $Gender 'M' = 'Male' 'F' = 'Female'; run; data Drug_Study; call streaminit(13579); length Chol_Group $ 6; do i = 1 to 1000; do Drug = 'Placebo','A','B'; Subject + 1; if rand('Bernoulli',.5) = 1 then Gender = 'F'; else Gender = 'M'; HR = rand('Normal',80,10) - 10*(Drug = 'A') + 10*(Drug = 'B') - 5*(Gender = 'F'); HR = round(HR); Cholesterol = rand('Normal',200,20) - 20*(Drug = 'A') -10*(Drug = 'B') - 10*(Gender = 'F'); Cholesterol = round(Cholesterol); if Cholesterol lt 180 then Chol_Group = 'Low'; else if Cholesterol lt 200 then Chol_Group = 'Normal'; else Chol_Group = 'High'; output; end; end; drop i; format Gender $Gender.; run; title "Listing of Drug_Study - first 9 observations"; proc print data=Drug_Study(obs=9); id Subject; var Drug Gender Cholesterol Chol_Group; run; |
The first nine observations from this data set are shown below.
Let's start out with the most basic summarization—computing statistics for all numeric variables for the entire data set. You can write a program as simple as:
proc means data=Drug_Study; run; |
However, this program will compute default statistics for every numeric variable in the data set (including Subject). You will probably want to include PROC MEANS options to select what statistics you want and a VAR statement to list the variables that you want to summarize. Here is an example:
title "Summarizing the Entire Drug_Study Data Set"; proc means data=Drug_Study n nmiss median mean std clm maxdec=3; var HR Cholesterol; run; |
The procedure options selected here are some of my favorites. This is what they represent:
| n | The number of nonmissing observations |
| nmiss | The number of observations with missing values |
| median | The median value (the 50th percentile) |
| mean | The mean |
| std | The standard deviation |
| clm | The 95% confidence limits for the mean. (You are 95% confident that the mean from which this sample was taken is between these two limits.) |
| maxdec | The maximum number of places to print following the decimal point |
Here is the output:

You can tell this is simulated (fake) data because there are no missing values. This would be very unusual in a real-life situation.
Most researchers would like to break down the two variables of interest (HR and Cholesterol) by some of the classification variables, such as Gender and Drug. You use a CLASS statement to do this. Let's start out by requesting statistics on HR and Cholesterol, broken down by Drug.
title "Variables Broken Down by Drug"; proc means data=Drug_Study n nmiss median mean std clm maxdec=3; class Drug; var HR Cholesterol; run; |
Here is the output:

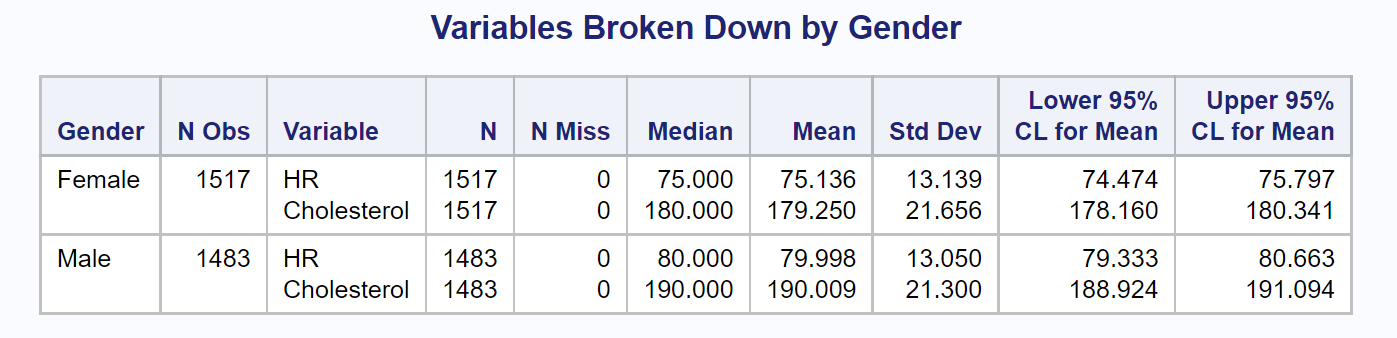
You could repeat this program, substituting Gender instead of Drug as the CLASS variable, yielding the following:
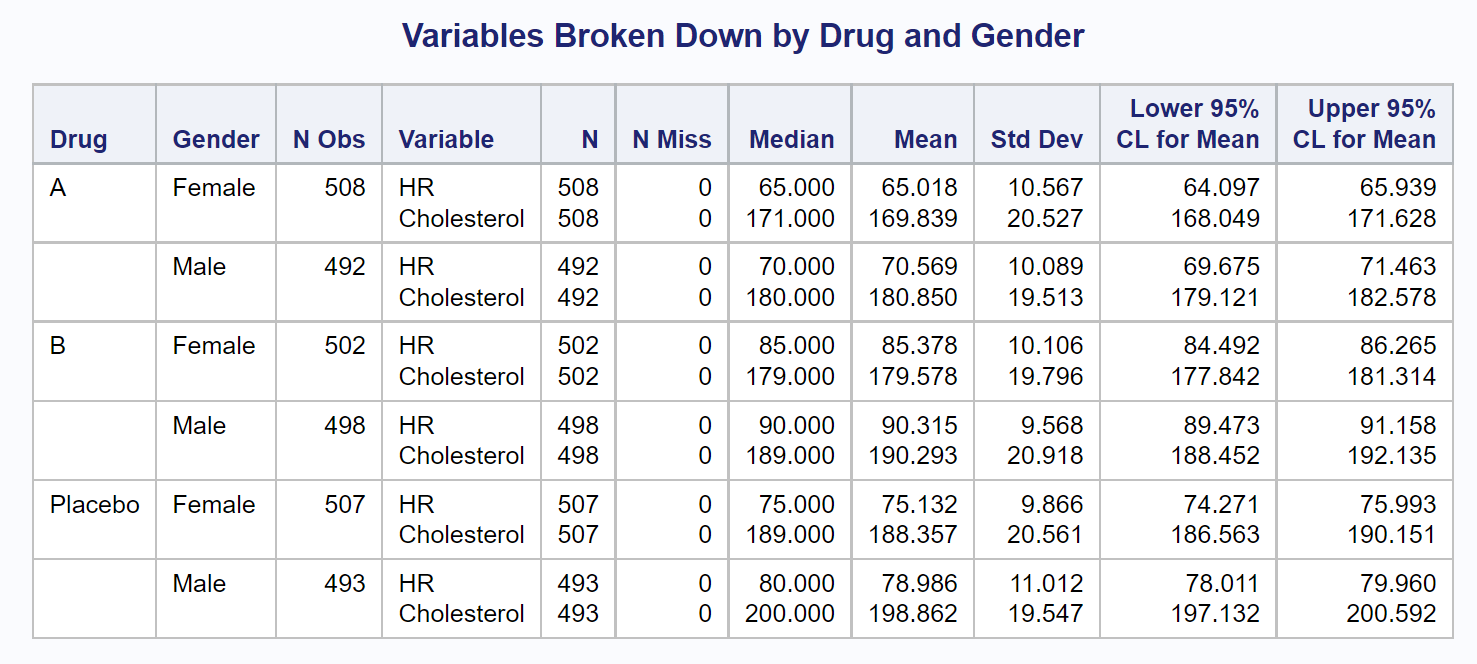
Finally, you can include a CLASS statement, listing those two class variables. The program, modified to show statistics broken down by Drug and Gender is shown next, followed by the output.
title "Variables Broken Down by Drug and Gender"; proc means data=Drug_Study n nmiss median mean std clm maxdec=3; class Drug Gender; var HR Cholesterol; run; |
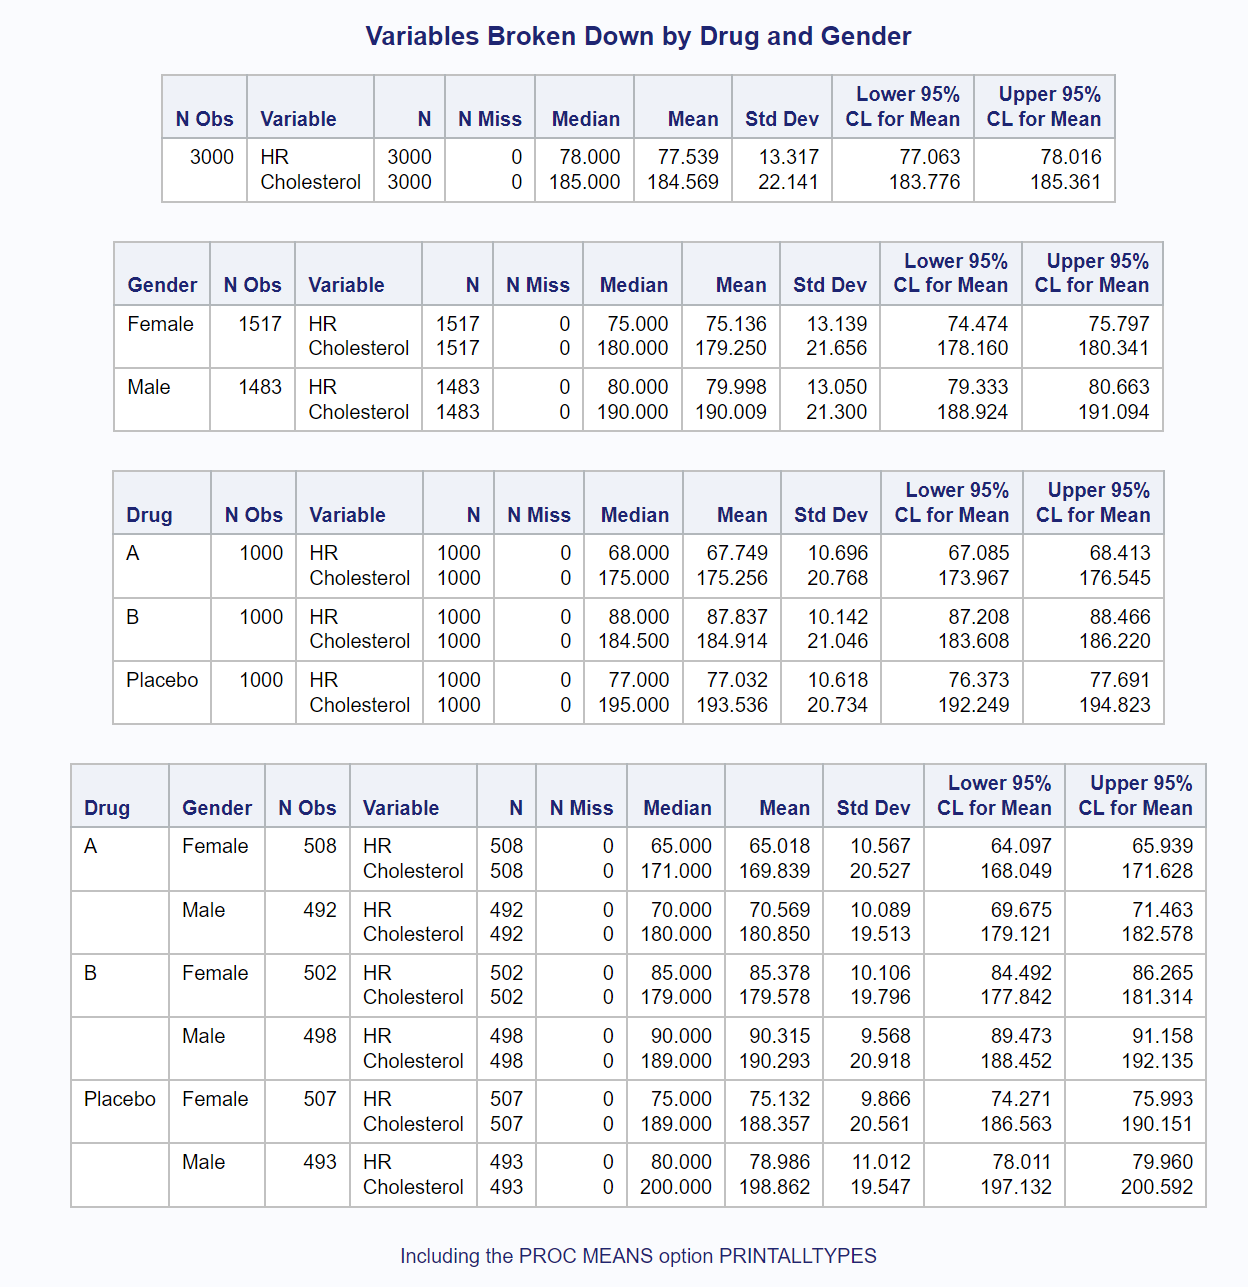
It is tedious having to run PROC MEANS four times to produce all of the outputs shown thus far. Instead, you can use the two CLASS variables and add the PROC MEANS option PRINTALLTYPES when you run the program. It looks like this:
title "Variables Broken Down by Drug and Gender"; footnote "Including the PROC MEANS option PRINTALLTYPES"; proc means data=Drug_Study n nmiss median mean std clm maxdec=3 printalltypes; class Drug Gender; var HR Cholesterol; run; |
In one run, you now see the two variables, HR and Cholesterol, for all combinations of the class variables as shown below.
All of the programs used in this blog were run using SAS OnDemand for Academics using the SAS Studio editor. You could have also produced all of the outputs using built-in SAS Studio tasks. You can read more about how to do this in my book A Gentle Introduction to Statistics Using SAS Studio in the Cloud.
As always, comments and/or corrections are welcome.

2 Comments
Wonderful job
Thank for sharing such informative blog about summarizing data.
There are many online tools that helps writers and bloggers to summarize data.
Keep sharing more.
SAS used to email me with blog comments, but I guess they don't do that anymore, because I just happened to see this comment. If you would like to see ALL of my blogs plus quite a few that were never posted, please check out "Cody's Collection of SAS Blogs" on Amazon. It's only $4.95!