The ODS Graphics software, first released with SAS 9.2, supported creating graphs directly from statistical procedures. Prior to this, very few statistical procedures created graphs on their own, and in most cases creating graphs was a post process or creating the graphs from the saved data using SAS/GRAPH procedures. With
Author
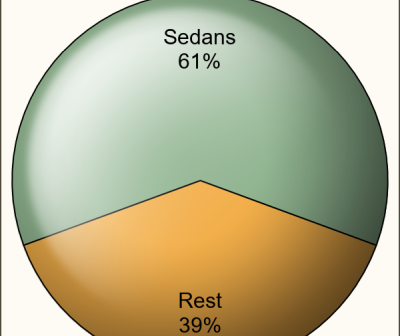
The SAS 9.4M6 software includes a new SGPIE procedure (preproduction) as introduced in the recent article - The SGPIE Procedure. In that article, I described the basic features of the two statements supported in the procedure, the PIE and the DONUT, with some examples. It is my humble opinion that
The 6th maintenance release of SAS 9.4 is now available for users. Along with it comes a new SG procedure - the SGPIE procedure (pre-production). The primary audience for the SG procedures has been the analytical user, for creating effective displays of analytical data. However, the rich feature set of these
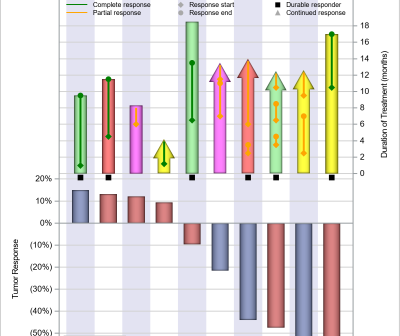
A few days back I published an article on including more subject data in a Waterfall graph. This was motivated by the desire from many users to view more data in the same graph, thus avoiding the need to refer to different graphs for the relevant information. In this case,
Previously, I have written articles on how we could display more subject response data along with the traditional WaterFall graph showing the best "Change from Baseline". This is in response to the desire to see data like treatment duration for each subject in the same graph. Otherwise, investigators have to
The TEXT plot was introduced with SAS 9.4M2 to facilitate placement of text strings in a graph. This replaces the MARKERCHAR feature of the SCATTER plot statement, which is still available, but it is better to use TEXT plot in most cases. The syntax is: text x=column y=column text=column </
Recently a colleague was requested to create a bar chart showing the performance of students in a school compared to county and state wide schools. The solution using SGPLOT was simple as shown below. /*--Create data--*/ data school; input Year Group $ Value; format Value percent5.1; datalines;
It seems only a few months back I posted an article on creating Pie Charts using a GTL based macro. Well, looking back, that was almost 6 years ago!! Recently, a colleague here at SAS needed to create Pie Charts in his report along with other plots created using SGPLOT
The PharmaSUG 2018 conference was held two weeks ago, with great enthusiasm and a record attendance. The highlight for me was the large spread on visual presentation of data, from papers to poster presentations. I will provide a more detailed report on all the exciting graphical presentations. One topic of
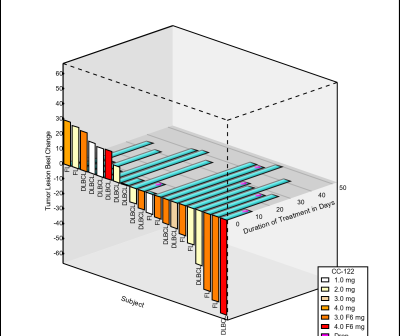
A while back a user requested to create a 3D WaterFall chart as presented by E Castanon Alvarez et. al. in "3D waterfall plots: a better graphical representation of tumor response in oncology" Annals of Oncology, Volume 28, Issue 3, 1 March 2017, Pages 454–456. I posted a blog article titled