Search Results: vbar (97)

Data Visualization
Sanjay Matange 0
Naomi's Graph Makeover Contest

Naomi Robbins has posted a contest, part 1 of which is to submit alternative representations for the following graph: Clearly, usage of two pie charts to represent the share of the B2B and B2C referrals will invite many responses.  To create the graph, I took the data shown in the Pie Charts themselves, so we are using percent

Data Visualization
Sanjay Matange 0
Doing more with nbsp

A few weeks ago I wrote an article on using the non breaking space character to prevent stripping of leading and trailing blanks in a string.   Since then, I have discovered a few more instances where the nbsp can be a useful tool for creating graphs. One such instance came up last week

Data Visualization
Sanjay Matange 3
Butterfly plots

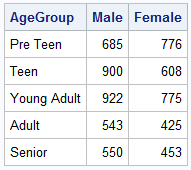
When comparing results by category and group,  putting the items to be compared close together usually leads to a graph that is easier to decode.  Take the case of the data (simulated) shown below. Here we have population by age group and sex.  To compare the population by sex, it is

Data Visualization
Sanjay Matange 6
Bar chart with response sort

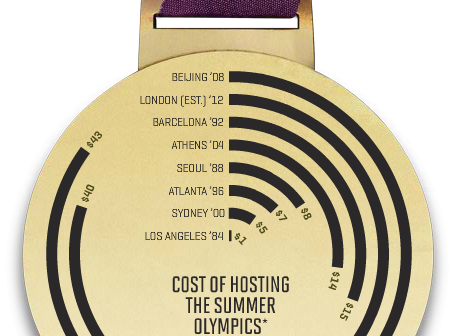
A graph in a recent article in Fortune magazine caught my eye.  The graph shows the cost of hosting the Summer Olympics over the past eight events.  Here is what I termed the "Medal" graph. Now, practitioners of the art of Effective Graphics would likely find some shortcomings in the graph.  Clearly

Data Visualization
Sanjay Matange 0
PharmaSUG 2012 update

PharmaSUG 2012 conference drew to a close today, concluding two and a half days packed with papers, presentations, posters, hands-on demos and super demos by SAS staff.  While the weather outside was a bit chilly from time to time, the conference what hopping with many user papers on how to

Data Visualization
Sanjay Matange 1
Bar chart on interval axis

Recently, a user asked about creating a Bar Chart of Value by Date, where the dates are displayed on a scaled interval axis.   Consider this simulated data set of value by date and treatment shown below.  This data set only has one value for each date and treatment combination. We can use the VBAR statement

Data Visualization
Sanjay Matange 6
Bar-Line graph

A user recently posted a question in the SAS communities forum about  how to best display two measures by one classifier using a Bar-Line graph, where the scale of the two measures is vastly different.  This got me thinking about various different ways to represent such data.  Here are some of my thoughts,

1 7 8 9 10