Search Results: vbar (97)

Data Visualization
Sanjay Matange 1
Financial graphs

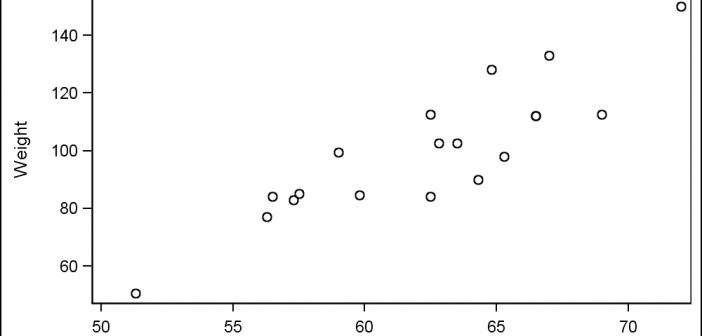
Browsing on the web, I ran into a simple but visually interesting graph of financial data.  Really, it could be any data, but this one showed up under "Financial Graphs".  I thought this would give me an opportunity to speak about an interesting new feature added to SERIES plot with

Data Visualization
Sanjay Matange 6
Graph Table with Class

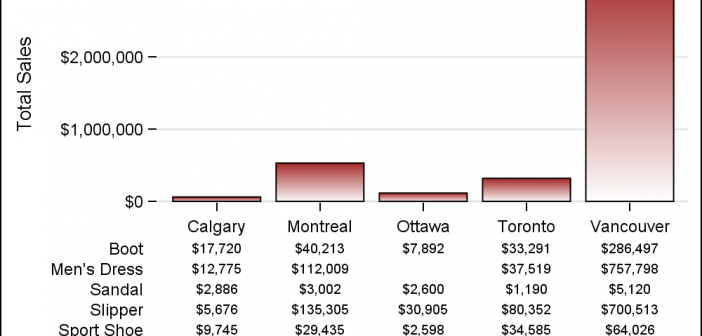
As often is the case, this article is prompted by a recent post on the SAS/GRAPH and ODS Graphics page communities page.  A user wanted to create a Graph Table showing a bar chart with tabular data for each of the category values along the x-axis.  The user was creatively using

Data Visualization
Sanjay Matange 2
Coffee Recipes

For a long time, Starbucks represented to me as the good coffee cup, with me paying upwards of $4 for a Latte.  But on a recent visit to San Francisco, my son introduced me to a few other options. Philz crafts a great cup of java, with the barista making

Data Visualization
Sanjay Matange 2
Legend Order

In the previous article on managing legends, I described the way to include items in a legend that may not exist in the data.  This is done by defining a Discrete Attribute Map, and then requesting that all the values defined in the map should be displayed in the legend. In

1 3 4 5 6 7 10