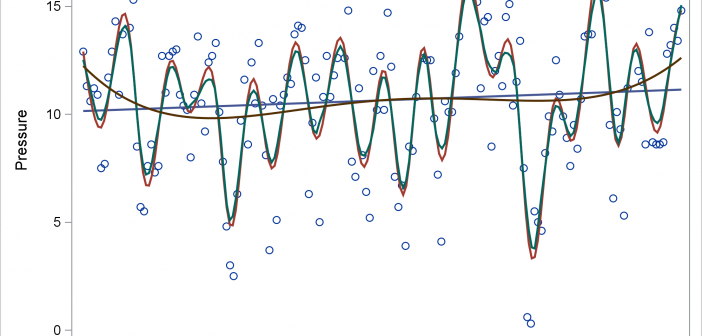
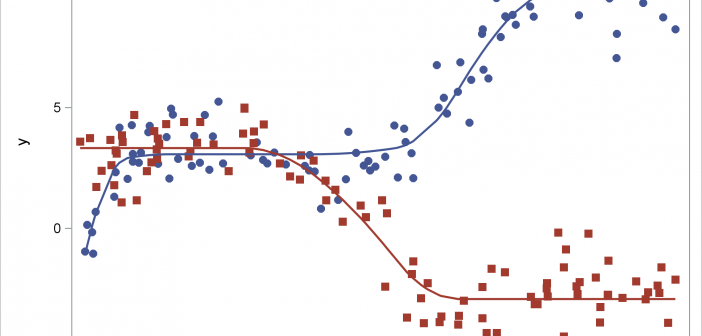
Today's post illustrates the REG, PBSPLINE, LOESS, SERIES, and SPLINE statements in PROC SGPLOT. The GROUP= and BREAK options in the SERIES statement are also discussed.

Today's post illustrates the REG, PBSPLINE, LOESS, SERIES, and SPLINE statements in PROC SGPLOT. The GROUP= and BREAK options in the SERIES statement are also discussed.

Many users of SGPLOT and GTL know how to mix and match various plot statements to create graphs, sometimes in ways not originally intended. You are also aware that you can go a step beyond, and use these systems to create completely non-standard graphs such as the Spiral Plot, the Polar
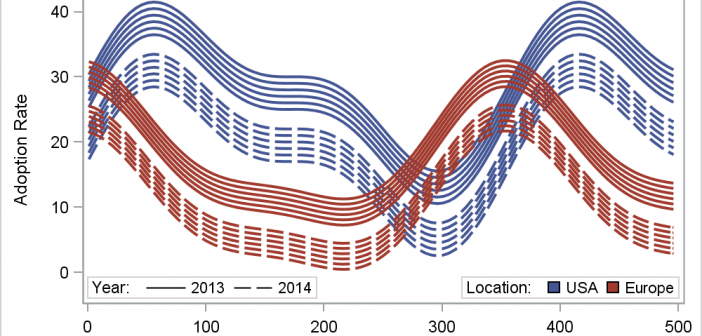
In her article Creating Spaghetti Plots Just got Easy, Lelia McConnell has provided us a glimpse into some new useful features in the SAS 9.4M2 release. The term Spaghetti plots generally refers to cases where time series plots have to be identified by multiple group classifications. The support for the
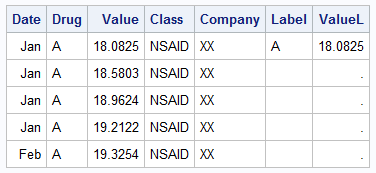
The series plot is a popular way to visualize response data over a continuous axis like date with a group variable like treatment. Here is some data I made up of a response value by date, treatment, classification and company that makes the drug. The data is simulated as shown in the attached program
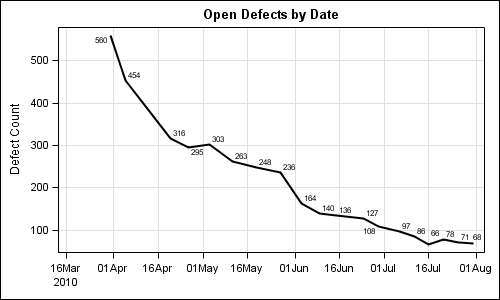
SG procedures and GTL use a collision avoidance algorithm to position data labels for a scatter or series plot. This is enabled by default. The label is preferably placed at the top right corner of the marker. The label is moved to one of the eight locations around the marker to
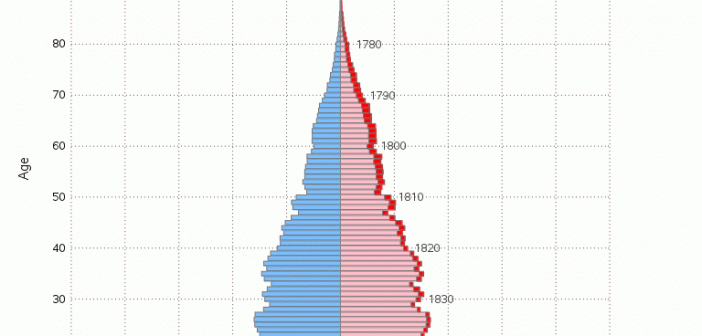
You've probably seen a population pyramid, such as this one I showed in a previous blog post. But let's scrutinize population pyramids a bit deeper, with an eye on special features that can make them even more useful! I was inspired to give population trees a second look by this
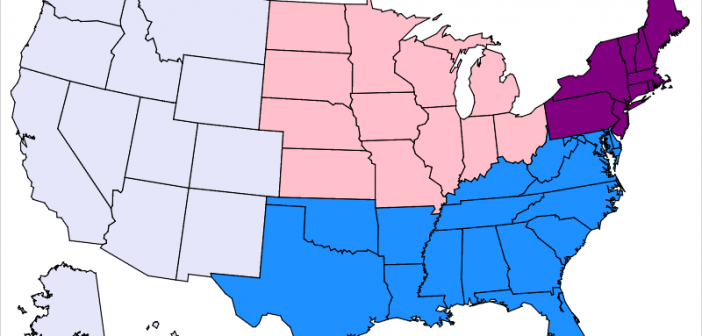
When you get something new, the hope is that it will be better than the old thing it's replacing. As I often do, I asked my Facebook friends to provide a random picture for my blog - in this case, a picture of one of their new/recent purchases. My friend
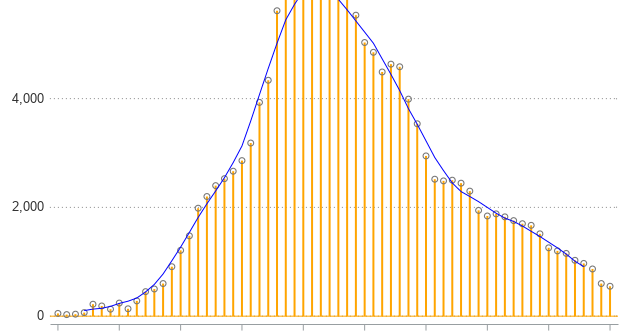
If you're close to my age, you probably remember Joe Walsh's song Ordinary Average Guy. That song popped into my head when I was writing this example about moving averages, so I encourage you to listen to it while reading the blog post. Many people are looking at graphs lately
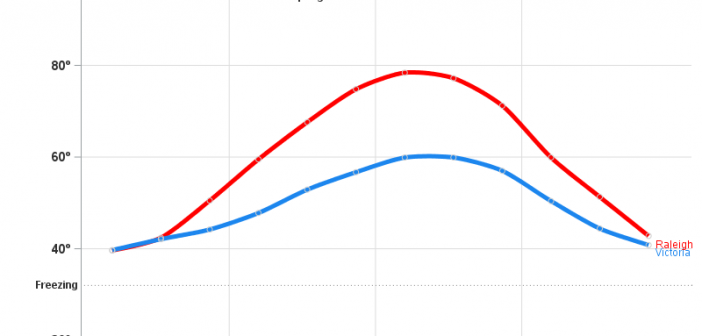
If someone proposes a bet to you, then you should be suspicious that they already know they're going to win. And one frequent topic of such bets is the weather... What if I bet you there's a city in Canada with a warmer average January temperature than Raleigh, NC? You
This post shows how to use PROC SGPLOT together with PROC TRANSREG to fit monotonically increasing or decreasing functions through a scatter plot.