Search Results: forest plot (33)

Data Visualization
Sanjay Matange 4
GTL Layouts

The Graph Template Language (GTL) provides you the ability to create complex graphical layouts. We have seen how to create a regular grid of cells based on one or more classification variables using the SGPANEL procedure.   Each cell contains the same type of plot.  This topic was covered in Dan's article on

Data Visualization
Sanjay Matange 8
Non-breaking space

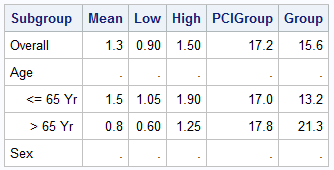
Forest plots come in many flavors.   An example of a Forest plot using GTL is available on the SAS support web site.  Simple forest plots can also be created using SGPLOT procedure by using the SCATTER statement with MARKERCHAR to display data aligned with the plot by study names. One issue

Data Visualization
Sanjay Matange 0
PharmaSUG 2012 update

PharmaSUG 2012 conference drew to a close today, concluding two and a half days packed with papers, presentations, posters, hands-on demos and super demos by SAS staff.  While the weather outside was a bit chilly from time to time, the conference what hopping with many user papers on how to

Data Visualization | Learn SAS | Programming Tips
Sanjay Matange 16
A Graphical Journey

The ODS Graphics software, first released with SAS 9.2, supported creating graphs directly from statistical procedures.  Prior to this, very few statistical procedures created graphs on their own, and in most cases creating graphs was a post process or creating the graphs from the saved data using SAS/GRAPH procedures. With