Search Results: box (88)

Data Visualization
Sanjay Matange 6
New Polygon Plot

The SAS 9.4 Maintenance 1 release is now shipping to users. This is great news for GTL and SG procedures users as this release includes some useful new features. Some of these are in direct response to your requests, and others are enhancements that we think you will come to like.

Data Visualization
Sanjay Matange 9
R U Graphing with SAS?

In recent conversations with many SAS users at NESUG, SESUG and WUSS, a pattern emerges on the question of creating graphs with SAS or R.  Many SAS users are aware of the new graph features in SAS that create high quality graphs with minimum fuss.  But, many have not actually used

Data Visualization
Sanjay Matange 2
Schematic Plot

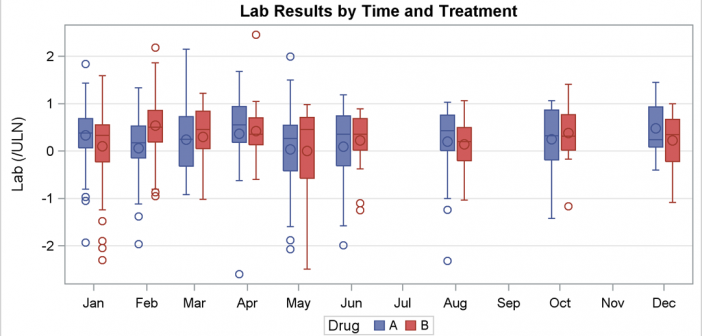
Recently a user chimed in on the SAS Communities page, requesting a way to add some observation level annotation to a box plot.  Wendy was delighted to see a graph created by the UNIVARIATE procedure called "Schematic Plot".  In this graph, the box plot of the analysis variable is shown with

Data Visualization
Sanjay Matange 1
Clark Error Grid Graph

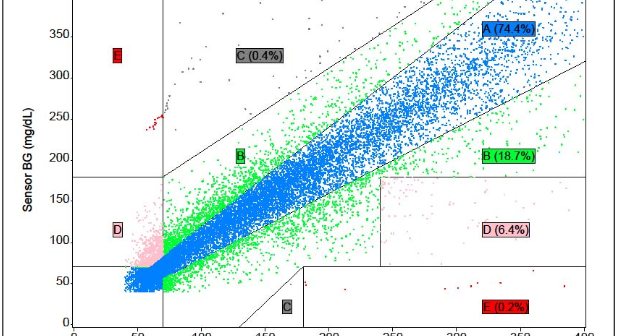
The SAS Global Forum conference last week was awesome.  From the perspective of graphics, there were more papers from uses on graphics and ODS graphics then in recent times.  I will post a summary shortly. One of the interesting papers was "#113-2013 - Creating Clark Error Grid using SAS/GRAPH and Annotate..."

Data Visualization
Sanjay Matange 0
Report from SCSUG 2012

Last week I attended my first SCSUG conference, this one in Houston.  Houston, the fourth most populous city in USA, is the world's capitol of the Oil and Gas industry.  So it was no surprise I met many attendees from local oil and gas related companies.  But, I also met many

Data Visualization
Sanjay Matange 0
Density Strip Plot

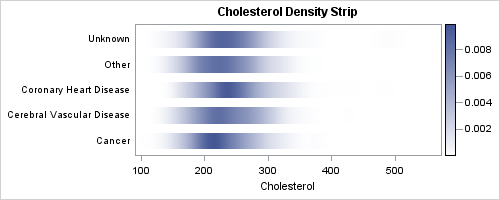
In the previous post on Violin Plots, we discussed the process to create custom density plots.  This work was done in collaboration with SAS user James Marcus.  This is the second installment on the same topic - Creating Density Strip Plots.  We will use the same data and process to compute

Data Visualization
Sanjay Matange 0
Report from SESUG 2012

This SESUG conference was a very energetic and rewarding experience, with many user presentations on graphics using SAS/GRAPH and ODS Graphics. One standout presentation for me was on "Data Merging and Exploration to Identify Associations Between Environmental Factors and Disease Outbreaks" by Neeta Shenvi, et. al.  The key part of

1 6 7 8 9