Search Results: box (88)

Data Visualization
Sanjay Matange 4
Box plot legend

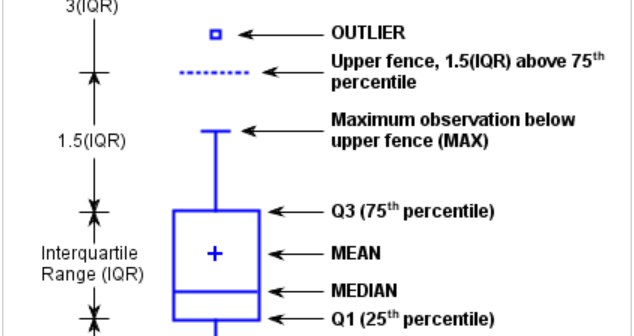
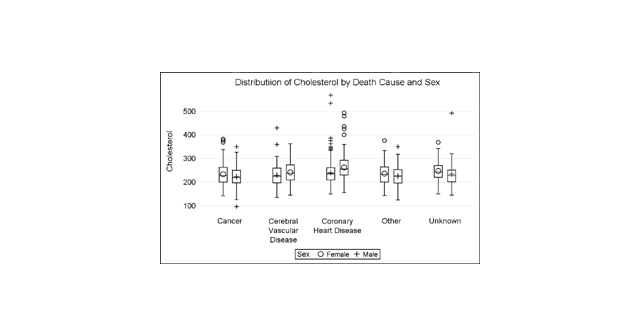
A grouped box plot created by SGPLOT VBOX / HBOX statement or GTL BOXPLOT statement will display groups within categories using group colors and puts the color swatches representing the group values in the legend.  This works well for a color graph created as shown below. title 'Distribution of Cholesterol

Data Visualization
Sanjay Matange 1
Scatter with box

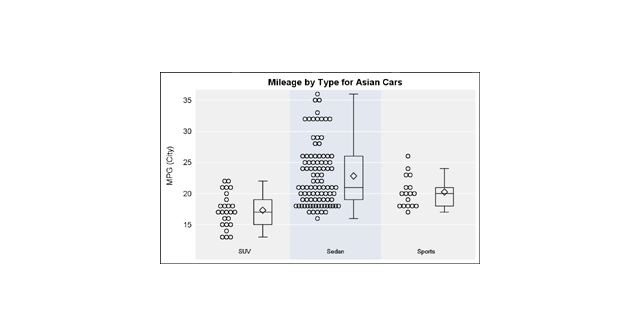
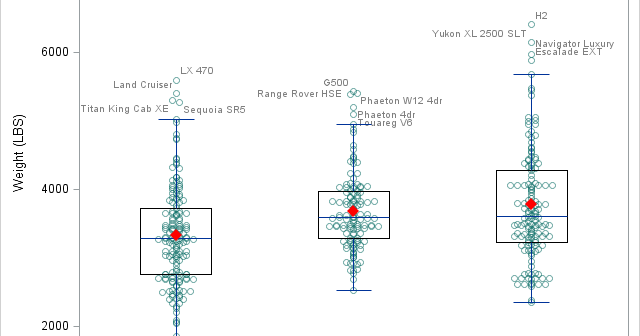
Previously, I discussed ways to create a Box Plot with Stat Table and Markers in the linked article.  One of the graphs showed a Box Plot of Cholesterol by Death cause along with the display of the actual observations.  The main goal for that article was display of statistics with

1 2 3 9