Programming Tips

Strengthen your programming skills with tips and techniques from the experts
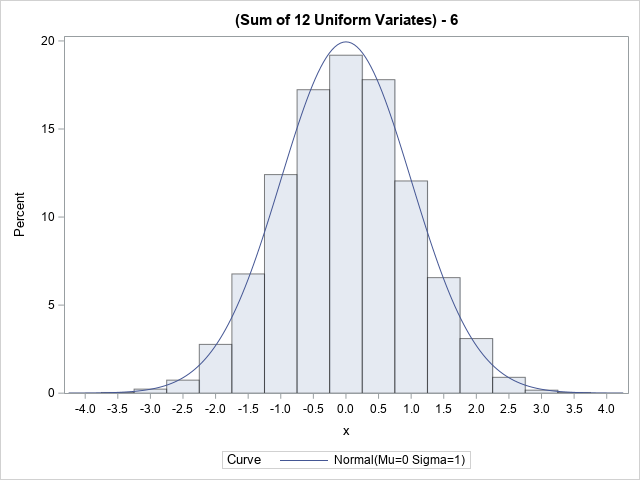
Data Visualization | Learn SAS | Programming Tips
Sanjay Matange 0
Spark grid

The 25th annual SESUG conference was held at in the SAS campus this week.  I had the opportunity to meet and chat with many users and attend many excellent presentations.  I will write about those that stood out (graphically) in my view. One excellent presentation was on "Methods for creating

Data Visualization | Learn SAS | Programming Tips
Sanjay Matange 0
Long category values

The South East SAS Users Group meeting wound up yesterday.  The 25th anniversary conference was held on SAS Campus and it provided a great opportunity to meet with many enthusiastic SAS users and attend many informative presentations.  More on this in a follow-up article. During one of these presentations, Mary

Programming Tips
Rick Wicklin 0
What is a factoid in SAS?

Have you ever seen the "Fit Summary" table from PROC LOESS, as shown to the right? Or maybe you've seen the "Model Information" table that is displayed by some SAS analytical procedures? These tables provide brief interesting facts about a statistical procedure, hence they are called factoids. In SAS, a

Data Visualization | Programming Tips
Warren F. Kuhfeld 0
Advanced ODS Graphics: A deeper dive into documents, dynamics, and data objects

You can modify all of the components of the graphs that analytical procedures produce: the data object, graph template, and the dynamic variables. This post takes a closer look at dynamic variables (which you can see by using PROC DOCUMENT) and data objects and explores graphs that are constructed from more than one data object.

Data Visualization | Learn SAS | Programming Tips
Sanjay Matange 0
Legend order redux

Once in a while you run into a pesky situation that is hard to overcome without resorting to major surgery.  Such a situation occurs when you have a stacked bar chart with a discrete legend positioned vertically on the side of the graph.  A simple example is shown below. title

Data Visualization | Learn SAS | Programming Tips
Sanjay Matange 0
Legend items

Plot statements included in the graph definition can contribute to the legend(s).  This can happen automatically, or can be customized using the KEYLEGEND statement.  For plot statements that are classified by a group variable, all of the unique group values are displayed in the legend, along with their graphical representation

Advanced Analytics | Programming Tips
Ryan Lolli 0
Tip and tricks to promote CAS tables from session-scope to global-scope

When loading data into CAS using PROC CASUTIL, you have two choices on how the table can be loaded:  session-scope or global-scope.  This is controlled by the PROMOTE option in the PROC CASUTIL statement. Session-scope loaded proc casutil; load casdata="model_table.sas7bdat" incaslib="ryloll" outcaslib="otcaslib" casout="model_table”; run; Global-scope loaded proc casutil; load casdata="model_table.sas7bdat"

Data Visualization | Learn SAS | Programming Tips
Sanjay Matange 0
Tips and tricks: Segmented discrete axis

The previous post on Multiple Blank Categories showed how to include multiple blank categories on the axis.  But, given the purpose for this was to separate different segments in the data, I also included ideas on how to segmented a discrete axis using reference lines or Block Plot.  A similar idea

Data Visualization | Learn SAS | Programming Tips
Sanjay Matange 0
Tips and tricks - Multiple blank categories on axis

Off and on, users have expressed the need to include multiple blank categories on a discrete axis.  Often, this is desirable to separate groups of bars (or categories) in a graph due to some difference their definition.  Such a case was discussed in this blog article on using non breaking

Learn SAS | Programming Tips
Jim Simon 0
How to format a macro variable

Would you like to format your macro variables? Easy!  Just use the %FORMAT function, like this: What?! You never heard of the %FORMAT function? Of course not, cuz it doesn't exist! No problem. Just create it, like this: %macro format(value,format); %if %datatyp(&value)=CHAR %then %sysfunc(putc(&value,&format)); %else %left(%qsysfunc(putn(&value,&format))); %mend format; The %FORMAT

Data Visualization | Learn SAS | Programming Tips
Sanjay Matange 0
New Features in SAS 9.40M5 - Gradient fills

ODS Graphics procedures primarily strive towards the following goal:  "Make simple graphs easy and complex graphs possible".   SGPLOT procedure allows you create simple graphs with a single plot statement, and create complex graphs by layering together or combining multiple plot statements.  Generally, the appearance follows the guidelines set by industry

1 35 36 37 38 39 65

Back to Top