Order matters. The order of variables in tables and rows of a correlation matrix can make a big difference in how easy it is to observed correlations between variables or groups of variables. There are many ways to order the variables, but this article shows how to display the variables in a correlation matrix in the same order that they appear in a loading plot or a component pattern plot. These plots are created in SAS by using PROC PRINCOMP or PROC FACTOR. The loading plot and the component pattern plot often look similar. Both plots show vectors in the plane, where each vector represents a variable in your data. Another similar-looking plot is the correlogram.
This article discusses the general problem of ordering a set of 2-D vectors by using the angles that they make with the horizontal axis. A subsequent article applies the solution to the specific problem of ordering variable in a correlation analysis.
Ordering vectors by angles
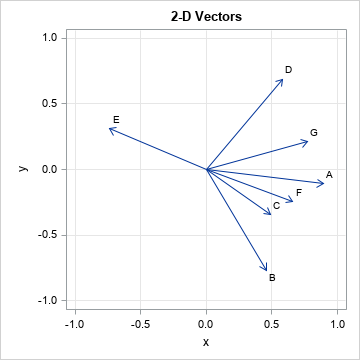
Suppose you have n non-zero vectors in the plane. Each makes an angle with the horizontal axis, as shown in the graph to the right for n=7. For convenience, I have labeled the vectors with the letters A-G. The goal is to order the vectors according to their angular relationship to each other. Of course, since angles are on a circle, you must decide which vector is first and what direction along the circle you will travel when listing the vectors.
Some authors (for example, Friendly (2002, "Corrgrams: Exploratory Displays for Correlation Matrices") and his %CORRGRAM macro) use the coordinate axes as the locations for deciding which vector should be placed first. I prefer to let the data determine the first vector. Notice that the gap between the E and B vectors is larger than the gap between other vectors. I will use the largest gap to determine the first vector and will list the remaining vectors in counterclockwise order. Thus, for this example, I choose to order the vectors as B, C, F, A, G, D, E. In general, I will develop an algorithm that finds the pair of vectors with the largest angle between them and chooses those vectors to be the first and last vectors in the order.
Sample Data
The following SAS DATA set defines the (x,y) coordinates for the tips of seven vectors in the plane. (The "tail" of each vector is the origin.) The call to PROC SGPLOT plots the vectors, as shown earlier.
/* example data: 7 vectors */ data Vectors; input Variable $ x y; datalines; A 0.89 -0.11 B 0.46 -0.77 C 0.49 -0.34 D 0.58 0.69 E -0.74 0.31 F 0.66 -0.24 G 0.77 0.21 ; title "2-D Vectors"; proc sgplot data=Vectors aspect=1; vector x=x y=y / datalabel=Variable; xaxis grid min=-1 max=1; yaxis grid min=-1 max=1; run; |
Angles of vectors
Although you can use Base SAS to perform the following steps, it is simpler and more readable to use the SAS IML vector/matrix language. The initial steps of the algorithm are as follows:
- Use the ATAN2 function in Base SAS to determine the angle that each vector makes with the X axis.
- The ATAN2 function gives angles in the interval (-π, π]. I want the angles to be in the interval [0, 2π), so add π to any negative angles.
- Sort the angles in a counterclockwise direction.
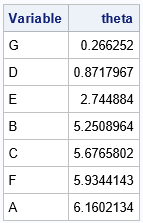
At the end of these steps, the angles will be in order according to the angle they make with the X axis.
proc iml; use Vectors; read all var {x y Variable}; /* read in vectors and labels */ close; n = nrow(x); pi = constant('pi'); /* (1) compute angles each vector makes with X axis */ theta = atan2(y, x); /* angle in range (-pi, pi] */ ndx = loc(theta<0); /* (2) jump discontinuity across the neg x axis; make continuous on [0, 2*pi) */ if ncol(ndx)>0 then theta[ndx] = theta[ndx] + 2*pi; /* (3) sort angles */ call sortndx(sIdx, theta); /* sort index */ theta = theta[sIdx]; print (Variable[sIdx])[L="Variable"] theta; |

The vectors are now sorted by the angles they make with the X axis. The next section finds the largest gap between vectors and uses the gap to determine a new ordering in which the first and last vectors have the largest gap between them.
Use gaps to determine the first vector
In the previous sequence, the first vector is the one that has the smallest angle with the X axis. This is an arbitrary criterion. Instead, I will use the gaps (angles) between vectors to determine the first vector. Let's identify the largest gaps between vectors and use that information to determine the first and last vectors in the list:
- Use the DIF function to compute the angular difference (the "gap") between each vector. Remember to include the difference between the vector with the largest angle (often in the fourth quadrant) and the vector with the smallest angle (often in the first quadrant).
- Find the largest gap between vectors.
- Use counterclockwise order to choose the first vector. It is the vector with the larger angle relative to the X axis. (Except if the X axis is in the gap.)
This is implemented with the following additional IML statements:
/* (4) compute difference between consecutive angles (including last minus first) */ gap = dif(theta//(2*pi+theta[1]), 1,1); /* discard first obs (.) in difference vector */ maxGap = gap[<>]; /* find the largest gap */ maxIdx = gap[<:>]; /* find the index of the largest gap */ print maxIdx maxGap (maxGap*180/pi)[L="maxGap (deg)"]; /* (5) if maxIdx=n, vectors are in correct sequence; otherwise, reorder */ if maxIdx < n then do; firstIdx = maxIdx+1; gIdx = firstIdx:n || (1:(firstIdx-1)); sIdx = sIdx[gIdx]; end; AngleOrder = Variable[sIdx]; print AngleOrder; |


The output shows that the maximum gap (143.5 degrees) occurs between the 3rd and 4th vectors, which are E and B. The program reorders the vectors so that B is first, and E is last. The final order is B, C, F, A, G, D, E.
Summary
Given a set of vectors in the plane, you can order them according to the angles they make with an arbitrary ray in the plane, such as the X axis. However, in some applications, it is more useful to list the vectors so that the one that are close to each other are also adjacent in the list. One way to do that is to find the largest gap between vectors and use the gap to determine the starting and ending vectors in the list. This algorithm is implemented in the SAS IML function in the Appendix.
Appendix
The following IML function accepts an (n x 2) matrix, V, where each row represents the head of a vector in the plane. It returns a permutation of the rows. You can use the permutation to reorder the rows so that the vectors are in sequential order by their polar angle. The first vector and the last vector have the largest angular gap between them.
proc iml; /* V is an (n x 2) matrix where the rows of V are 2-D vectors in the plane. Return a permutation that will sort the rows so that the vectors are sorted in order of angles. The first and last vector have the largest gap between them. */ start Sort2DVecByAngle(V); /* compute angles each vector makes with X axis See https://blogs.sas.com/content/iml/2015/06/10/polar-angle-curve.html */ pi = constant('pi'); n = nrow(V); theta = atan2(V[,2],V[,1]); /* angle in range (-pi, pi] */ ndx = loc(theta<0); /* eliminate jump discontinuity at theta=pi by using [0, 2*pi) */ if ncol(ndx)>0 then theta[ndx] = theta[ndx] + 2*pi; /* sort angles */ call sortndx(sortIdx, theta); /* sort index */ theta = theta[sortIdx]; /* compute difference between consecutive angles (including last minus first) */ gap = dif(theta//(2*pi+theta[1]), 1,1); /* discard first obs (.) in difference vector */ maxIdx = gap[<:>]; /* find the largest gap */ /* if maxIdx=n, vectors are in correct sequence; otherwise, reorder */ if maxIdx < n then do; firstIdx = maxIdx+1; gIdx = firstIdx:n || (1:(firstIdx-1)); SortIdx = SortIdx[gIdx]; end; return SortIdx; finish; STORE module=Sort2DVecByAngle; /* test the function by running it on an example */ use Vectors; read all var {x y Variable}; close; sortIdx = Sort2DVecByAngle(x||y); newVarOrder = Variable[sortIdx]; /* reorder the list of vectors */ print newVarOrder; |
The output is the same as in the main program and is not shown. The new order of the vectors is B, C, F, A, G, D, E.

1 Comment
Pingback: Order variables by using a loading plot - The DO Loop