Programming Tips

Strengthen your programming skills with tips and techniques from the experts
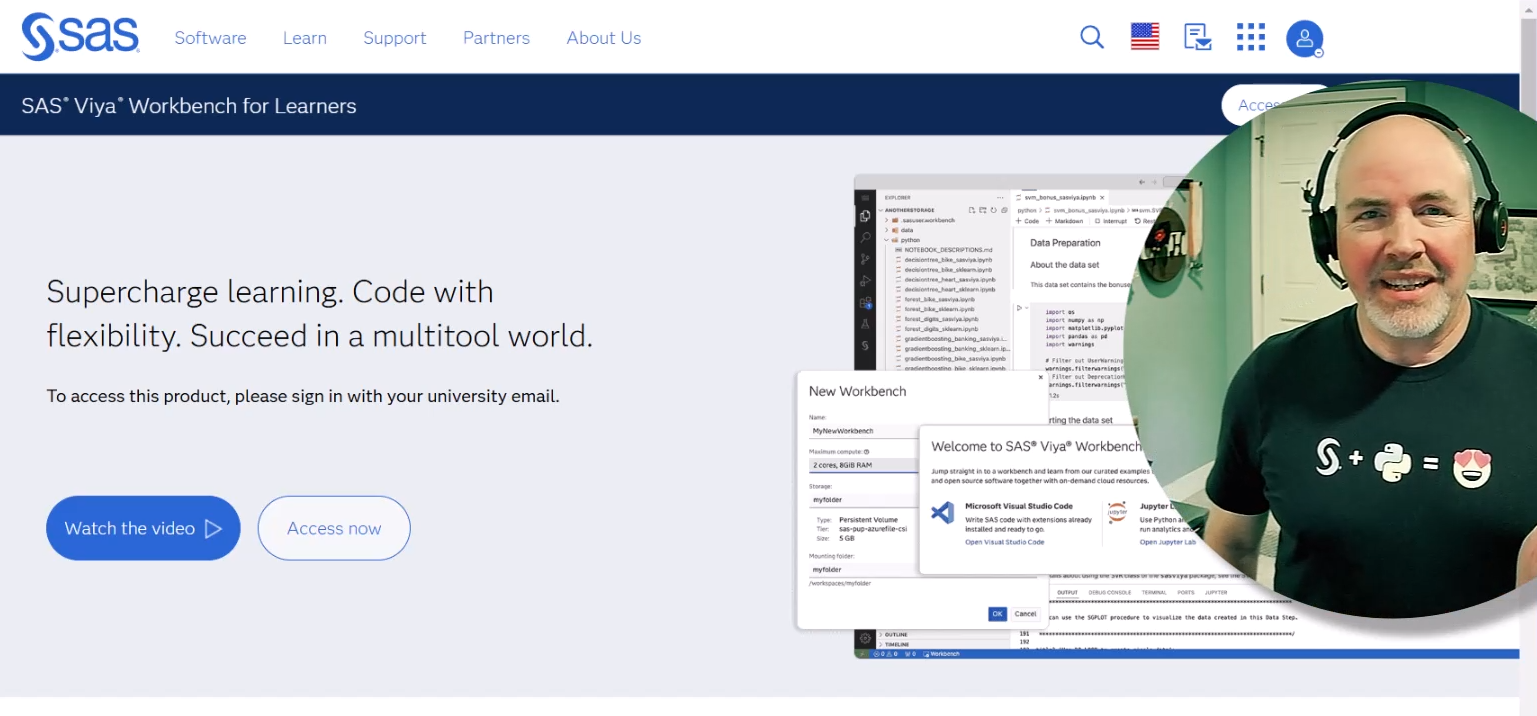
Data Visualization | Learn SAS | Programming Tips
Sanjay Matange 0
Little things go a long way

In my previous post, I described a new options to control the widths of the caps for Whiskers, Error and Limit bars.  This topic could have been titled "Little things go a long way", as such details really make for a good graph. In a similar manner, another detail issue

Programming Tips
Rick Wicklin 0
Mean imputation in SAS

Imputing missing data is the act of replacing missing data by nonmissing values. Mean imputation replaces missing data in a numerical variable by the mean value of the nonmissing values. This article shows how to perform mean imputation in SAS. It also presents three statistical drawbacks of mean imputation. How

Data Visualization | Learn SAS | Programming Tips
SAS Korea 0
[SAS 프로그래밍 팁] ODS 템플릿 수정 기법

이 기사는 SAS Korea가 번역 및 편집했으며 원래 Rick Wicklin이 썼습니다. 원문이 여기에 있습니다. 이번 블로그를 통해 ODS 템플릿을 효율적으로 수정할 수 있는 SAS 프로그래밍 기법, 일명 ‘커펠드 템플릿 수정 기법(Kuhfeld’s Template Modification Technique; TMT)’을 소개하고자 합니다. 다섯 단계만 거치면 20줄 미만의 SAS 코드만으로 이 기법을 구현할 수 있는데요. 방법은 간단하지만

Data Visualization | Learn SAS | Programming Tips
Sanjay Matange 0
Spark table

In the previous post, I discussed creating a 2D grid of spark lines by Year and Claim Type.  This graph was presented in the SESUG conference held last week on SAS campus in the paper ""Methods for creating Sparklines using SAS" by Rick Andrews.  This grid of sparklines was actually the

1 34 35 36 37 38 65

Back to Top