Get the right information, with visual impact, to the people who need it
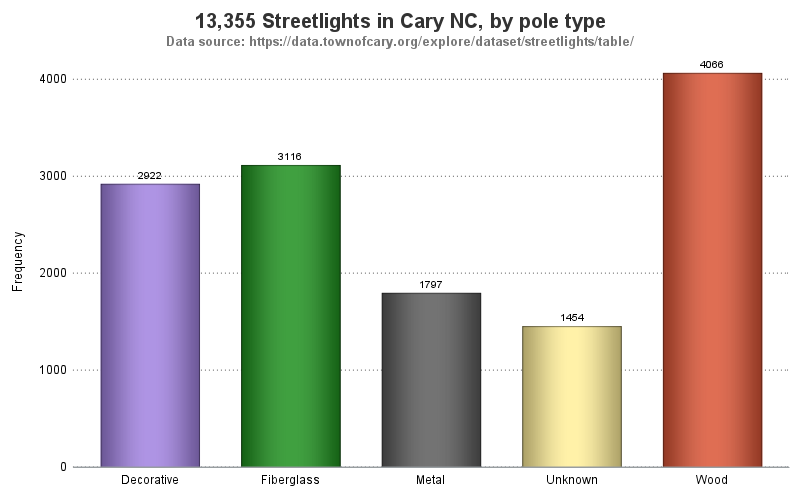
Cary NC data - streetlights

Many cities have Open Data pages. But once you download the data, what can you do with it? This is my third in a series of blog posts where I download several datasets from Cary, NC's open data page, and give you a few ideas to get you started on