Data Visualization

Get the right information, with visual impact, to the people who need it
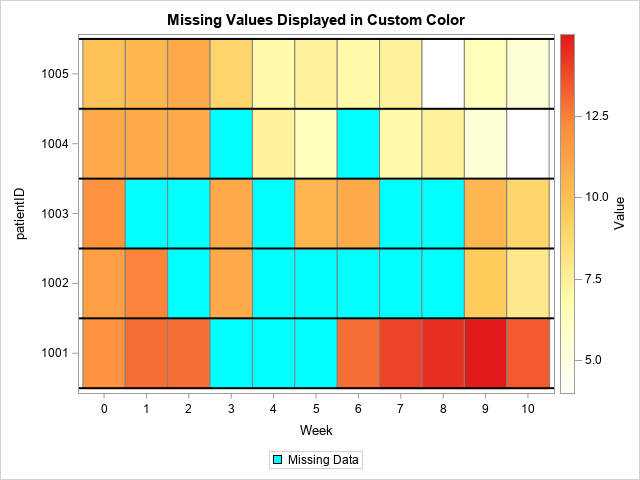
Data Visualization
Sanjay Matange 0
Cancer Deaths Averted

Significant progress in reduction of Cancer mortality is shown in a graph that I noticed recently on the Cancer Network web site.  This graph showed the actual and projected cancer mortality by year for males.  The graph is shown on the right. The graph plots the projected and actual numbers

Data Visualization
Sanjay Matange 0
Displaying Unicode Symbols in Legend

Including special Unicode symbols into the graph is getting more popular.  In general, SG procedures support Unicode strings in places where these strings are coded into the syntax such as TITLE, FOOTNOTE.  These support Unicode characters and also the  special {SUP} and {SUB} commands.  This is because these statements are rendered

Data Visualization
Sanjay Matange 0
Marker Symbols

There has been much discussion on the SAS Communities page on usage of different symbols in a graph.  The solutioin can vary based on the SAS release.  New features have been added at SAS 9.4 releases to SG Procedures and GTL that make this very easy.  With SAS 9.4M1, almost any combination is

Data Visualization
Sanjay Matange 0
Custom Labels

Over the Christmas Holidays I saw an graph of agricultural exports to Russia in 2013.  The part that caught my eye was the upper part of the graph, showing the breakdown of the trade with Russia as a horizontal stacked bar with custom labels. The value for each region / country

Data Visualization
Sanjay Matange 0
Graph Table

A common scenario is where we have a table of multiple measures over time. Here we have a simple example of Frequency and Response by Day.  The Response is a linear function of the Frequency, as shown in the table on the left below. The  shape of the data is

1 41 42 43 44 45 60

Back to Top