Oh, no! Your boss just told you to change the way that SAS displays certain features in graphs, such as missing values. But you have a library of hundreds of SAS programs! Do you need to modify all of your previous programs? Fortunately, the answer is no. SAS provides ODS styles that control the colors and attributes that appear in graphs and tables. By using styles, you can make one change that affects all graphs that use the style.
This article provides a simple introduction to modifying a graph style in SAS. To keep things simple, the article shows how to modify the GraphMissing style element, which is used to render markers, lines, and bars that represent missing values.
Style modification is not hard, but I do not recommend it for beginning programmers because it requires familiarity with several aspects of SAS software. The appendix describes simpler ways to modify the attributes of graph elements.
An example of style modification: Change the missing-value color
A previous article about SAS graphs shows how to change the missing-value color by using a range attribute map. You can use the range attribute map on a case-by-case basis to modify the missing-value color in graphs.

The range attribute map is a good solution when you are creating a new graph. However, it will not affect existing graphs. For example, if your company runs a SAS report every morning that creates hundreds of graphs, the colors in those graphs will not change unless you rewrite the programs to explicitly use the range attribute map. In contrast, if you create a new ODS style and render the graphs in that style, existing programs will reflect the change.
This article shows how to change the missing-value color by modifying the GraphMissing style element. By default, my ODS style uses gray to display a tile or marker that represents a missing value as shown in the scatter plot to the right. In this graph, the gray-colored markers represent patients that have missing values for the cholesterol variable. In this example, I will replace gray with a bright color (cyan) so that the change is obvious.
This article solves the following subtasks:
- What is the current ODS style in your SAS session?
- Which style template defines the style element that you want to modify?
- How do you modify the style element?
- How do you use the modified style?
Creating a new ODS style requires knowledge about the way SAS works. The appendix provides references that contain more details about how to modify an ODS style.
What is the current ODS style?
You can discover which ODS destinations are open by using the Dictionary.Destinations dictionary table or the Sashelp.Vdest view. For each open destination, the output also shows the ODS style for the destination, as follows:
proc print DATA=SASHELP.VDEST; run; |
In the SAS 9 windowing Environment, you might see the following output:
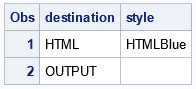
This output tells you that the HTML destination is open and is using the HTMLBlue style. Other SAS interfaces might give different results. For example, running SAS in SAS Studio might give the following output:
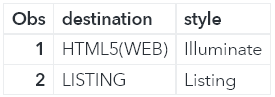
This output tells you that the HTML5 destination is open and is using the Illuminate style.
The remainder of this article uses the HTMLBlue style, but the methods apply to any other style.
Which style template defines the style element?
The information in this section is not strictly necessary, but I think it is useful for understanding how the GraphMissing style element is defined. This section shows how to find the definition of a style element that is currently being used. The subsequent section shows how to override the element.
Styles inherit properties from other styles, so it isn't always easy to find which template defines an element. I usually start by displaying the definition of the active ODS style. If necessary, I display the parent style, the parent-of-the-parent style, and so forth until I find the definition of the element.
For example, the following statements display the definition of the HTMLBlue style in the log:
proc template; source styles.HTMLBlue; run; |
define style Styles.HTMLBlue;
   parent = styles.statistical;
   class GraphColors /
      'gndata12' = cxECE8C4
      'gndata11' = cxDBD8F8
      'gndata10' = cxC6E4BF
...
end; |
If you look at the HTMLBlue template, you will see that it does not define the GraphMissing style element. No problem; let's look at the parent style next. The HTMLBlue style inherits properties from the Statistical style, so let's display that template definition:
proc template; source styles.Statistical; run; |
define style Styles.Statistical;
   parent = styles.default;
...
   class GraphColors /
      'gncdata12' = cxF9DA04
      'gncdata11' = cxB38EF3
      'gncdata10' = cx47A82A
...
      'gcmiss' = cx979797
      'gmiss' = cx848484
...
end; |
The Statistical style does not define the GraphMissing element, but it does define the shades of gray that are used to graph missing values. The 'gmiss' color is used for the fill color of tiles and bars, and the 'gcmiss' color is used for lines and markers. Although you can override these colors, I prefer to override the GraphMissing style element, so let's keep looking. The Statistical style inherits properties from the Default style, so let's display that template:
proc template; source styles.Default; run; |
define style Styles.Default;
...
   class GraphMissing /
      fillpattern = "X5"
      markersize = 7px
      markersymbol = "hash"
      linethickness = 1px
      linestyle = 2
      contrastcolor = GraphColors('gcmiss')
      color = GraphColors('gmiss');
...
end; |
Here, at last, is the definition of the GraphMissing style element. You can see that the ContrastColor and Color properties are based on the 'gcmiss' and 'gmiss' colors, respectively, in the current ODS style. The next section shows how to redefine the GraphMissing element.
How to modify the style element
We want to redefine the ContrastColor and Color properties of the GraphMissing element. The following statements define a new style called "MyMissing". In this style, I choose cyan (bright blue) to be the color for missing values. I probably wouldn't choose this color for serious work, but it will make it easy to see the new missing-value color for this example.
proc template; define style MyMissing; /* name of new style */ parent = Styles.HTMLBlue; /* inherit attributes from HTMLBlue */ class GraphMissing / contrastcolor = cyan /* color used for markers and lines */ color = cyan; /* fill color used for bars and cells */ end; run; |
That's it. The MyMissing style inherits properties from the HTMLBlue style and overrides the ContrastColor and Color attributes of the GraphMissing element. If you use the MyMissing style, all graphical features that correspond to a missing value will be displayed in cyan.
How to use the modified style
Let's use the new style. Because I am using the HTML destination, I will specify the name of the style on the ODS HTML statement. The following statements use the style to visualize the blood pressure and cholesterol values of 200 patients in a clinical study:
ods html style=MyMissing; /* <== use the new style */ %let WhiteYeOrRed = (CXFFFFFF CXFFFFB2 CXFECC5C CXFD8D3C CXE31A1C); title "Missing Values Displayed in GraphMissing Color"; proc sgplot data=Sashelp.Heart(obs=200); scatter x=Diastolic y=Systolic / colorresponse=Cholesterol markerattrs=(symbol=CircleFilled size=9) colormodel=&WhiteYeOrRed; gradlegend; legenditem type=marker name='Miss' / label="Missing" markerattrs=GraphMissing(symbol=CircleFilled); keylegend 'Miss'; run; ods html style=HTMLBlue; /* <== restore the previous style */ |
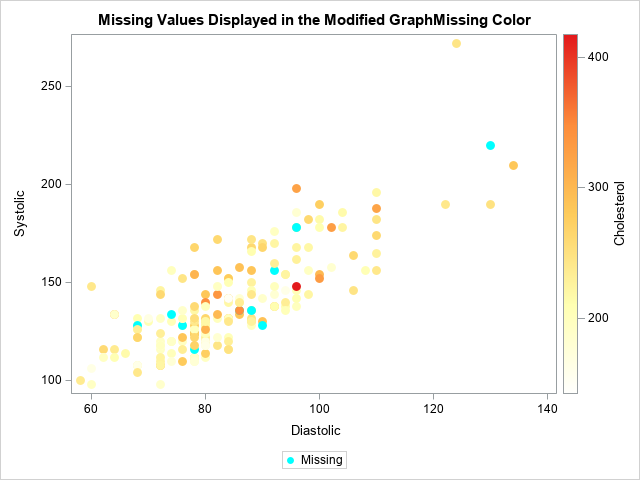
The new scatter plot is shown. It is a scatter plot of the blood pressure measurements for 200 patients. The color of a marker indicates the patient's cholesterol levels. You can see that some patients have a missing value for their cholesterol level. Those markers are displayed in the GraphMissing color, which is cyan for this new ODS style. In the previous scatter plot, those markers were colored gray.
Summary
SAS graphs use ODS styles to determine the attributes of elements in a graph, such as markers, lines, and bars. This article shows a simple example of how to modify an ODS style for a graph in SAS. The example shows how to redefine the color used to represent a missing value.
Further reading
Modifying an ODS style is not the easiest way to change the attributes of graphs. If you are new to SAS, the SGPLOT procedure supports several simpler ways to change attributes:
- Use the "ATTRS" statements, such as MARKERATTRS and LINEATTRS, to set the attributes for a specific plot.
- Use the STYLEATTRS statement to control attributes that are shared across several plots that you overlay in a single graph.
- Use a range attribute map to control attributes that are not supported on the STYLEATTRS statement.
- For modifying graphs that are created automatically by SAS procedures, see the section "ODS Graphics Template Modification" in the SAS/STAT User's Guide. The documentation describes useful techniques and macros such as the %ModStyle and %GrTitle macros, which simplify common tasks.
If you decide that you need to modify an ODS style, read the following articles:
- Heath, Dan (2017), "Diving Deep into SAS ODS Graphics Styles."
- Rosanbalm, Shane (2016), "Fifty Ways to Change your Colors (in ODS Graphics)."

1 Comment
Thank you for sharing, this will be very useful