Data Visualization

Get the right information, with visual impact, to the people who need it
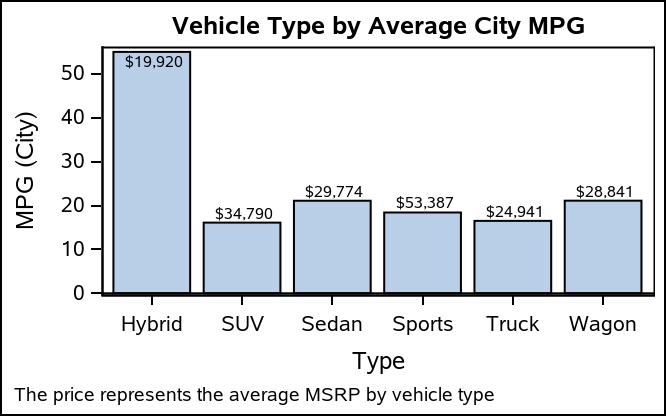
Data Visualization
Sanjay Matange 0
Report from PharmaSUG 2015

PharmaSUG 2015 in Orlando was held at the Renaissance had a record breaking attendance of over 650.  Weather was great, except for a huge downpour on the evening of the last day.  All the popular presenters were in attendance including Art Carpenter, Kirk Lafler, Arthur Li and many others. Presentations

Data Visualization
Sanjay Matange 0
Report from SGF 2015

SGF 2015 was a blast with a focus on Visual Analytics, SAS Studio, Hadoop and more.  Graphs were everywhere, and it was a banner year for ODS Graphics with over 15 papers and presentations by users on creating graphs using SG Procedures, GTL and Designer. Dan Heath, Prashant Hebbar, Scott

Data Visualization
Leo Sadovy 0
The new map of global manufacturing

any factors go into your strategic global business decisions, from the physical placement of factories and distribution centers, to your choice of suppliers and partners, to your target markets and the business model itself. Businesses have a choice of fundamental global go-to-market investment strategies, from direct foreign investment on the one

Data Visualization
Sanjay Matange 0
Micro Maps

MicroMaps are a powerful way to display data where the display includes small, lightweight maps to provide geographical information regarding the data.  This geographical information gives clues to the relationship between the data that could lead to more insight. The SAS SG Procedures and GTL do not currently have built-in

1 39 40 41 42 43 60

Back to Top