How to compute decision limits for multiple comparisons

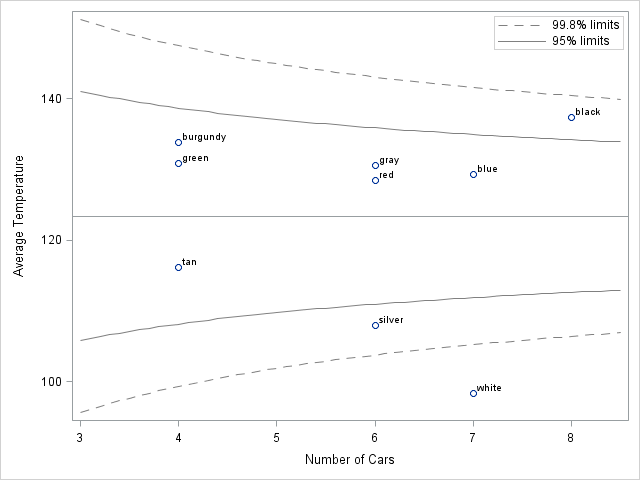
In last week's article on how to create a funnel plot in SAS, I wrote the following comment: I have not adjusted the control limits for multiple comparisons. I am doing nine comparisons of individual means to the overall mean, but the limits are based on the assumption that I'm