The most likely birthday in the US

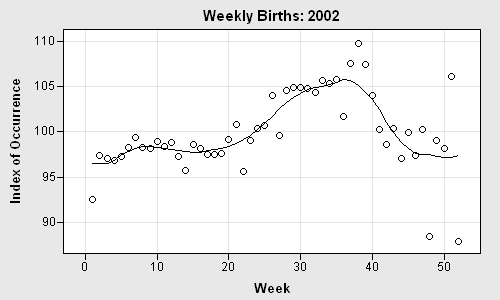
Do you know someone who has a birthday in mid-September? Odds are that you do: the middle of September is when most US babies are born, according to data obtained from the National Center for Health Statistics (NCHS) Web site (see Table 1-16). There's an easy way to remember this