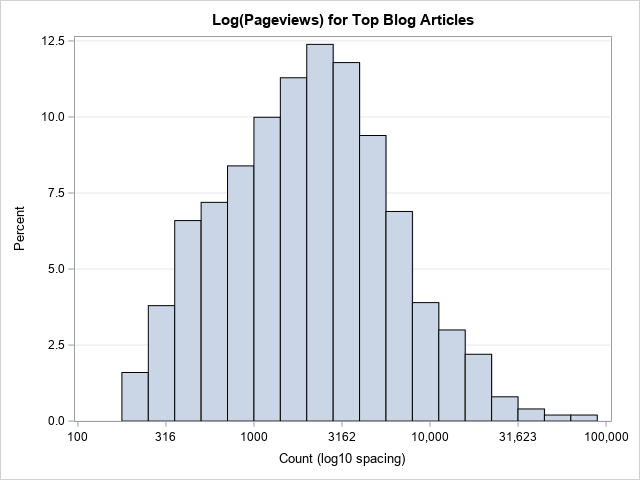
How to use a log-scale on a histogram

Real-world data often exhibits extreme skewness. It is not unusual to have data span many orders of magnitude. Classic examples are the distributions of incomes (impoverished and billionaires) and population sizes (small countries and populous nations). The readership of books and blog posts show a similar distribution, which is sometimes