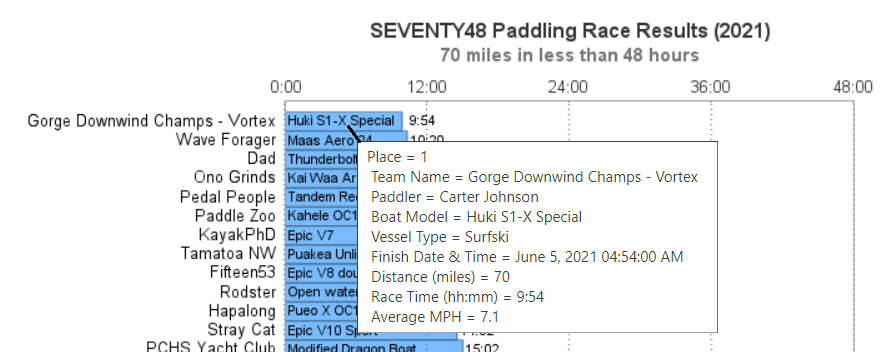
I've got this buddy, Carter Johnson - he's a little bit crazy, but a lot of fun to follow... He holds/held several different long-distance paddling world records, and was one of the coaches for the group that paddled kayaks from Cuba to the US (see my blog post). A few
Tag: paddling
I'm a bit of a boat paddling enthusiast, as you might have guessed from some of my previous paddling blog posts. The amount of exertion in race-paddling is similar to running - the longest race I've paddled in a race so far was 13 miles (half-marathon distance). But in the
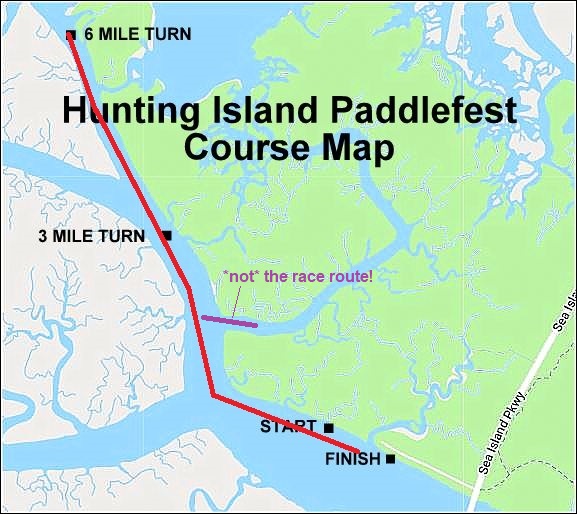
With all this sitting at a desk writing code, I have to do something to keep in shape. And for me, that something is paddling boats ... as fast as I can - and occasionally trying to race them. This past weekend I entered the race at Hunting Island, SC.
As you might have guessed from some of my previous blog posts, I'm an avid paddler. I like to paddle boats, and I like to try to go fast! And when I'm considering buying a new boat, it's only natural that I would analyze the data to make an informed
Ever since the Moneyball book & movie came out, athletes have been scrambling to use data and analytics to gain a competitive advantage. One of my favorite sports is boat racing - the ones you paddle. Follow along as I lead you through some maps and graphs I created for
I recently paddled in a boat race, and was wondering how I did compared to all the other paddlers. And being a Graph Guy, I decided I should find a cool way to graph the data ... Here's some background information ... There's a great organization called Bridge II Sports
I just returned home from an expedition/adventure boat trip to Cuba, and Talk Like a Pirate day is coming up this Saturday - what a combination for an interesting blog! I hope you enjoy a few pictures, and a bit of data analysis on these topics! A couple of weeks ago,
One of my earlier blogs on handling percent (%) values in SAS was very popular (it's been viewed over 34,000 times!), so I thought I'd write a similar blog on handling time (mm:ss.ss) values in SAS ... This past weekend I was in a dragonboat race (that's me in the
In sports these days, there's a lot more data to keep track of than just the score! How can you make sense of it all? Being the Graph Guy, of course I recommend graphing it! Here's an example that's up close and personal for me - dragon boat racing... Below