As you might have guessed from some of my previous blog posts, I'm an avid paddler. I like to paddle boats, and I like to try to go fast! And when I'm considering buying a new boat, it's only natural that I would analyze the data to make an informed decision. Follow along as I analyze the trade-offs between speed and stability while trying to decide whether to buy a new boat.
The boat I've been paddling lately is a surfski. A surfski is a long/skinny sit-on-top kayak. It goes pretty fast (because it's long and skinny), and it's suitable for paddling in the ocean (since it's a sit-on-top, and you don't have to worry about the cockpit filling with water). But one thing about a skinny kayak is that it's also tippy (if you don't have good balance and paddling skills, it can tip over). The surfski I'm currently using is a 20ft Epic V10 Sport. It's a composite hybrid of fiberglass, carbon fiber, and Kevlar, and a bit wider and heavier than the surfskis the pros use.
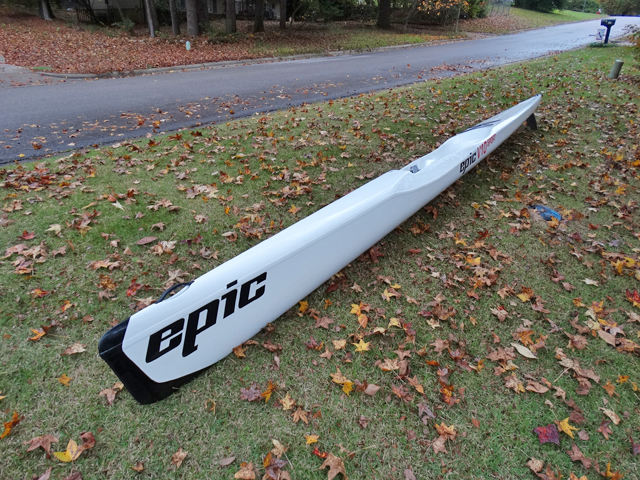
If I paddle hard, I can generally go 5.5 to 6.5mph in my V10S. That's pretty fast, but still a bit slower than my buddies who paddle Olympic-style K1 sprint kayaks ... and I hate to lag behind when they let me practice with them. Therefore when the opportunity to buy a used Epic V12 Ultra surfski popped up, it piqued my interest. It's a foot longer, 2 inches more narrow, and about 7 pounds lighter than my boat ... and reputed to be a good bit faster! But with more speed comes less stability ... and you can't go very fast if you keep falling out of your boat!
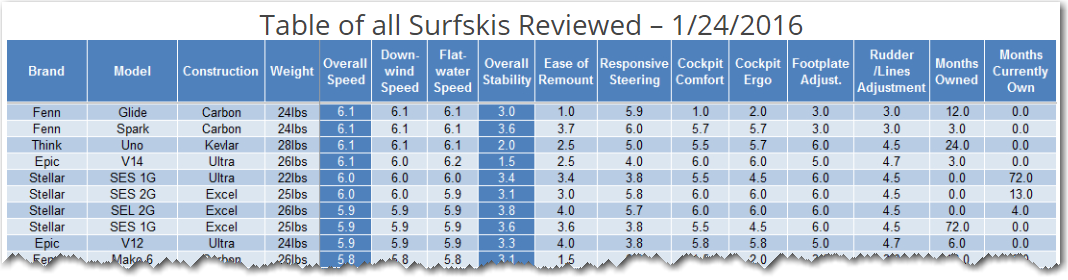
So my decision on whether to pursue the V12 depended on (potentially) how much faster it is, and how tippy it is. I did a bit of web searching, and came across a page on the surfskiracing.org website full of wonderful data on this topic. Wesley Echols is an avid paddler who has owned many (many-many) surfskis, and he was kind enough to collect data on each one, and rate their stability and speed (and several other factors) on a numeric scale. Here's an example of the data in his table:
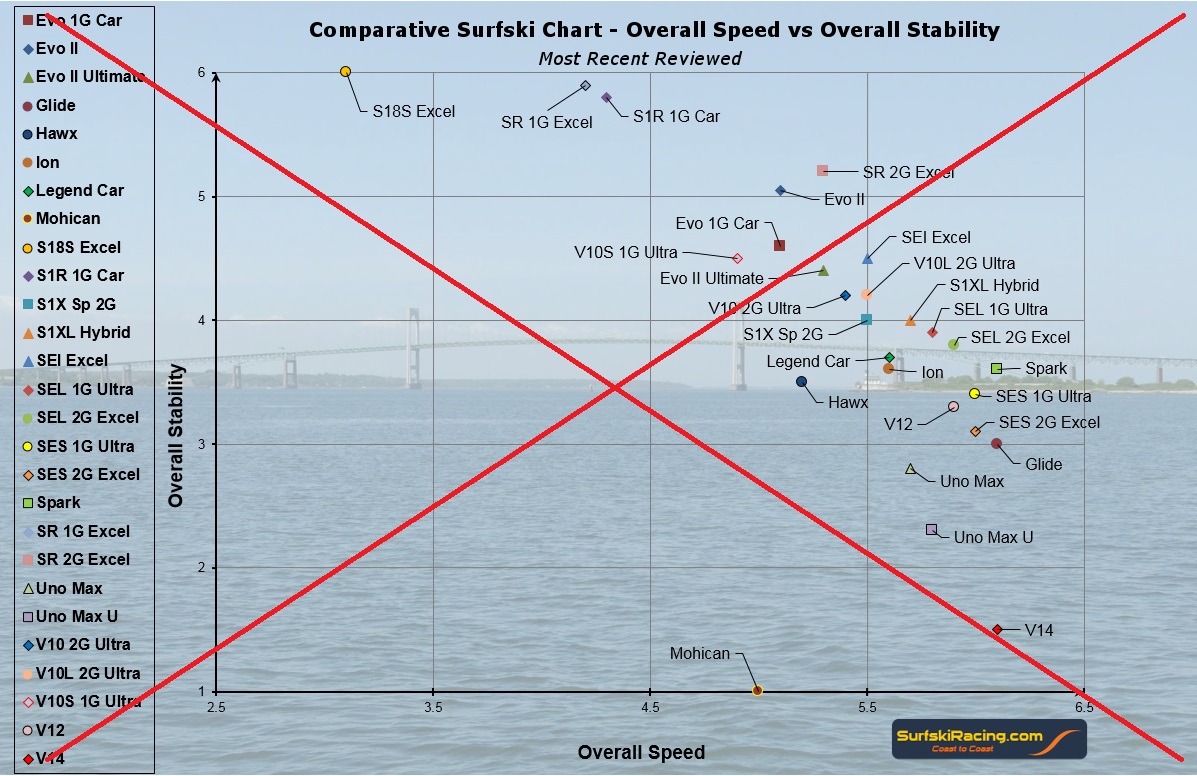
And he had a few graphs of subsets of the data, such as the following:
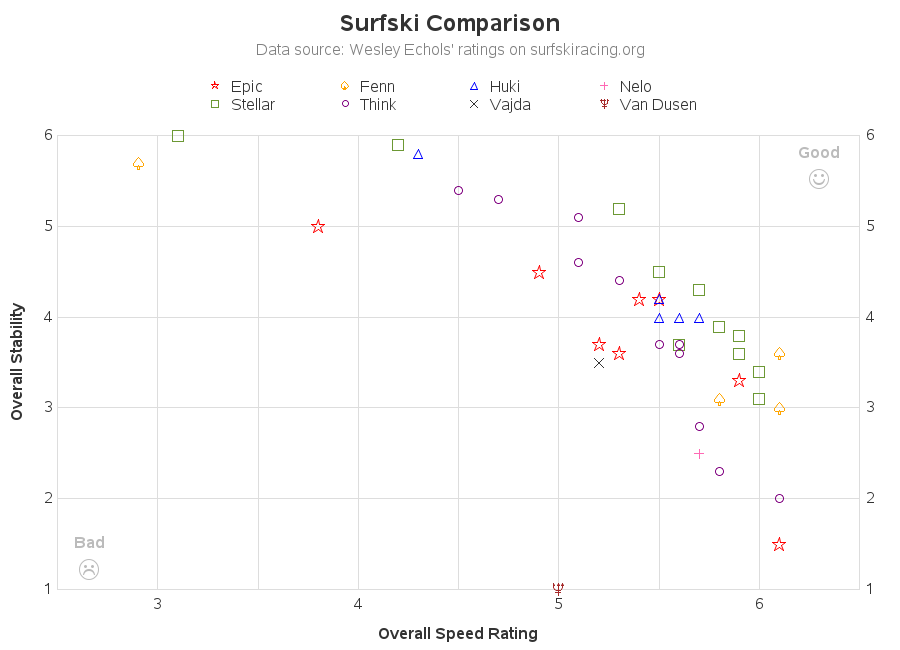
I loved that they had data & graphs, but I was chomping at the bit to try creating my own graph. Here are a few of the changes and enhancements I had in mind:
- Eliminate the background picture of water. It's pretty, but it distracts from the data.
- Plot all 42 boats on one graph, rather than several graphs with subsets.
- With more dense plot markers (42 of them), it would be impractical to label all the markers on the graph - therefore I planned to add HTML mouse-over text, using Proc GPlot's html= option. I will be able to include the brand, model, and construction (type of material) in the mouse-over, as well as the values of all the various ratings.
- Rather than having a unique color and shape for each marker (which is too many for a person to keep track of visually), I plan to use a single shape/color for each brand.
- Use outline markers, rather than solid filled ones, so it is easier to tell if there are overlapping markers in the same location.
- Label the stability axis on the right-side of the graph (using Proc Gplot's plot2 statement), since most of the markers are near that side.
- Add labels (using annotated text and Unicode face characters) showing which direction is good, and which is bad.
Here's the graph I came up with. Click it to see the interactive version with the mouse-over text.
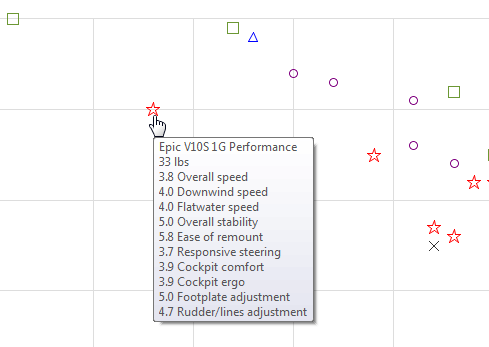
Here's a screen-capture of some sample mouse-over text, for my Epic V10S:
And one finishing touch (more for me, rather than the general user)... Since I don't live close enough to the ocean to practice there, I'm more concerned with the flatwater speed (lake/calm water), rather than the downwind speed (waves/ocean). So I added a graph of the flatwater speed data - and for completeness I also added one for the downwind speed data. Here's the flatwater graph, with my V10S and the V12 circled:
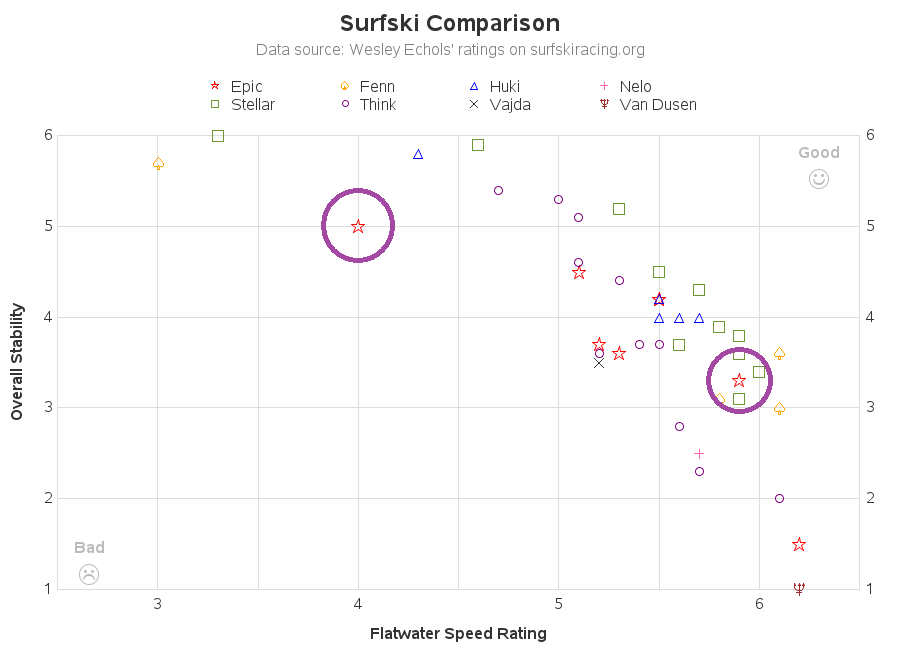
Looks like the V12 will be a definite step up in speed, with a relatively small sacrifice in stability ... on paper, at least. The true test will be paddling the boat, which I plan to do after work today. I will be happy if I can get an extra 1mph, without falling out of the boat! :-)

10 Comments
Funny how close the SAS Community is sometimes....
My partner is a kayaking SAS nerd who forwarded me this post as one of the best uses of SAS Graph she'd ever seen :-)
"Kayaking SAS nerd" - three things I approve of! :)
Never heard of surfskis before. Now I want to learn more. One thing I think would enhance your analysis is adding the cost of the surfski in the mouse-over info.
I guess a take away for me in your visual example is that we need to help SAS customers draw insights and make decisions from data quicker. What is known, based on industry information, is that the V12 is narrower (probably lighter) and quicker based on design, and less stable as a result. A recommendation therefore might be that you set that information as baseline and initially start investigating all other correlates to speed and stability. Maybe machine learning algorithms can drill down on other metrics for us. What would be your study design approach to finding these correlates from information that exists today, based on general boat, SUP or kayak design? Is displacement at issue?
So, did the data analysis really inform your ability to decide which choice is better vis a vis speed vs stability? It seems that it didn't. Maybe what's missing is a) information on your paddle stroke and cadence, b) an X factor for conditions like waves/wind, and c) energy inputs using wearable fitness device :)
I think the data was useful, in the sense that it let me know there was a big enough potential difference in the boats that I might want to try out the V12. But yes - there are a *lot* of other factors in deciding whether it would be a better boat for me! :)
data on paper vs data in reality and the associated variables. Hopefully with practice you'll overcome the tippiness and gain more speed. I look forward to seeing an updated future graph! ;-)
Perhaps I'll just work on improving my paddling technique & body-strength, and see if I can go faster in my current boat for now :)
How did your test go? Curious to know if you got the extra 1mph?
I paddled it about 5 miles last night. For 'normal paddling' it was about the same speed as my old boat. When I pushed it pretty hard I was getting about 7mph (about 1/2 mph faster than my old boat). It was a bit tippier, so if I were to get used to the tippiness, hypothetically I could put more 'umph' into my paddle stroke. I did fall in once, after about 3 miles. So my conclusion ... undecided! :)