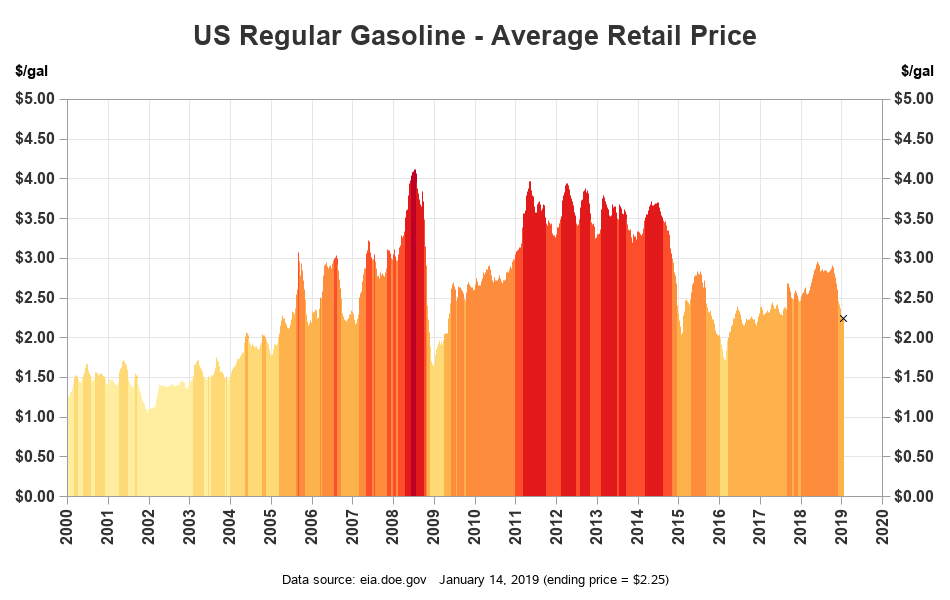
When I fill up my daily-driver Prius, the price of gasoline isn't that important. But when I occasionally take a trip in my V8 Suburban, I pay a lot more attention! Therefore I was pleasantly surprised when I noticed that gasoline prices have been falling. How much have they fallen,
Tag: oil
Over the years, the US has drilled for crude oil in several locations, such as Pennsylvania, Texas, Alaska, and the Gulf of Mexico. A few years ago, as the US started drilling more in North Dakota, there were forecasts that we would surpass Saudi Arabia in crude oil production. And recently,
I recently read an interesting article about petroleum coke (petcoke). A lot of it is produced in the US, and lately a lot of it is consumed (burned) in India ... contributing to air pollution there. The article mentioned some numbers in the text, but the data was really begging to
Last week, one of the major pipelines supplying gasoline to the eastern US broke. Do you know where the break is, and which states will be having shortages? Me neither! ... So, of course, I created a SAS map to help... First I read up about the spill on various
I recently bought a vehicle that has FlexFuel capability and can use E85 (mostly ethanol) fuel. But can you guess whether it is more economical for me to use E85, or regular gasoline? Read the SAS analysis below to see if you guessed right! I've been the happy owner of
Did you ever wonder how much fuel all the jets in the world use? Perhaps these graphs will help you get a handle on it... Before we get started, here's a jet-fuel related picture to entertain you. This is a picture I took from the airplane when I went to
Did you know you could drive 74 million cars using the wasted natural gas that is flared from oil wells and refineries? Learn more details in this blog post! Flaring (burning) is commonly used to dispose of natural gas produced at oil and gas facilities that lack the infrastructure to capture it
I recently saw an article on washingtonpost.com showing what methods are used to generate electricity in each state. The data was interesting enough that I decided to try my hand at graphing and mapping it with our SAS software. Read along to see what I kept the same, and what
Dust off that old aphorism about an ounce of prevention. Oil companies applying analytics for predictive maintenance can see a substantial downtick in the unanticipated equipment repairs that quickly eat into an oil well’s profitability. Maintenance is far from a trivial concern in the oilfield. A pumping oil well is
This month we take a fresh analytical view of our hypothetical VirtualOil portfolio by comparing the forward price of WTI (the green line) to the prompt month price (red line). The resulting graphic (chart 1) demonstrates the relative stability of the 48-month forward price in contrast to a very active spot
Oil is bouncing around the $50 range as the market adds and loses value with each new headline, from potential new Iranian exports after the nuclear talks to the slowest month of inventory builds at Cushing since Thanksgiving. The US rigcount is down nearly 23 percent year-over-year, but the rate
The topic of fracking has been in the news a lot lately - this blog post explores some of the finer points of plotting opinion data related to fracking ... I recently saw the following graph on dadaviz.com. It showed some interesting data, and presented the data in a way
Admit it - you were fascinated by the 3D pipes screensaver! How many CPU cycles did we let our machines burn up, drawing and re-drawing those silly pipes!?! What was your personal favorite CPU-hungry screensaver? (let us know in a comment!) Well, speaking of pipes, the proposed Atlantic Coast Pipeline