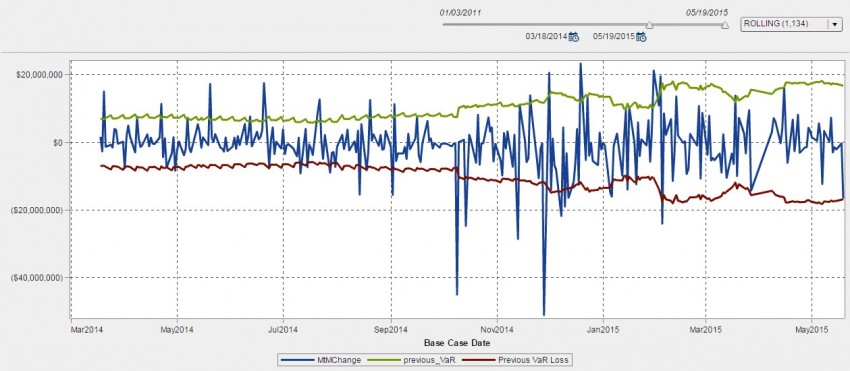
This month we take a fresh analytical view of our hypothetical VirtualOil portfolio by comparing the forward price of WTI (the green line) to the prompt month price (red line). The resulting graphic (chart 1) demonstrates the relative stability of the 48-month forward price in contrast to a very active spot price, though the forward price has been on a downward trend since 2011. The blue line shows the forward premium of that 48-month price.
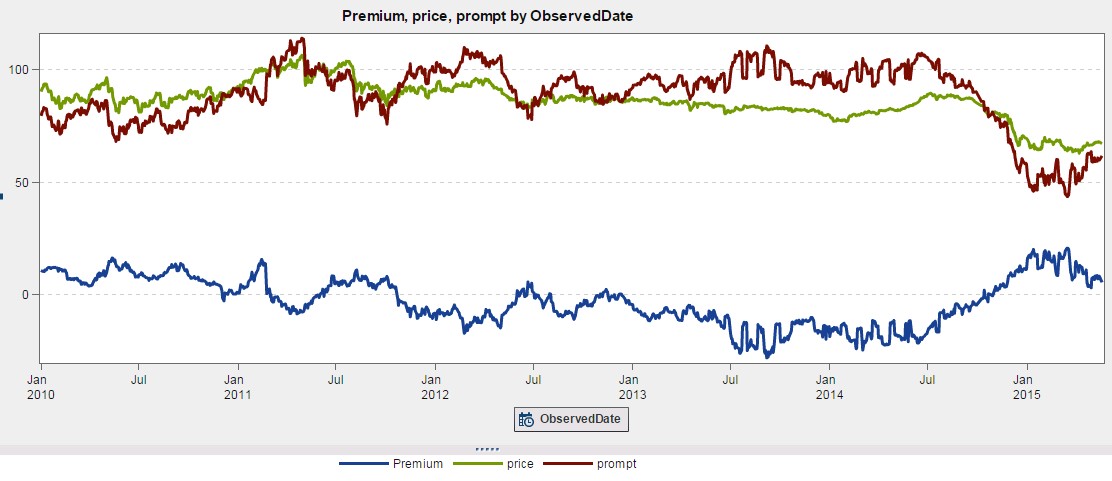
We can see the market has returned to normal backwardation (spot higher than forward price) after a two-year period of very strong contango (forward price higher than spot price). We can also see how the forward curve tracks the prompt month price. While it has a somewhat stabilizing influence, almost all of the swing in the market is based on that spot price.
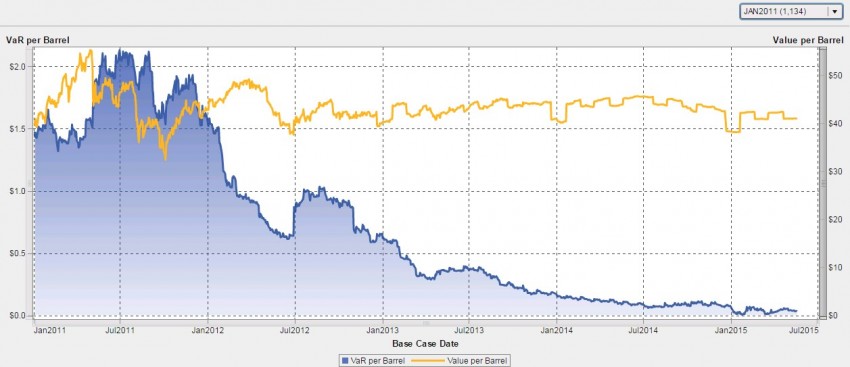
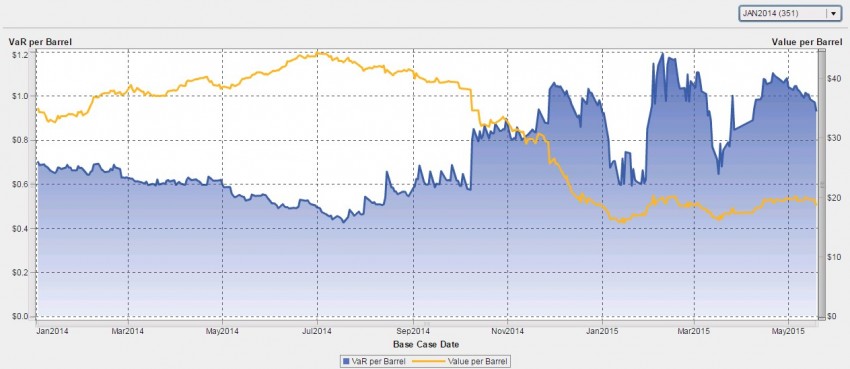
This is reflected in our rolling five-year VirtualOil portfolio (chart 2). The portfolio’s value-per-barrel aligns with the prompt month price, and this month we see a small recovery in value as well as a sizable increase in Value-at-Risk.

That’s no surprise for our unhedged, options-based portfolio. As we move above of $50 strike price, the value of the options and the amount of risk both increase. How does this benchmark track against your levels of risk, once the additional costs and risks of recent business decisions borne by your physical oil operations are factored in? How have shut-ins, layoffs and other responses to the low-price environment impacted the value of your portfolio, your cashflow and other key metrics?
You can also compare VirtualOil with your analysis to determine how hedging has benefited your company in the downturn. Paying the forward discount gained by the high prices of the past two years meant you were buying insurance for when the spot price tumbled. Those who were hedged through the recent large drop in prompt month prices could take advantage of the premium and would fare significantly better than those who were not.
Take these two charts together and you might draw two distinct conclusions: The premium starting to narrow again suggests a likely continued rise in spot prices, but the wake of the oil price crash has increased overall volatility and left plenty of risk in the market. Cautious optimism is the word of the day, but more toward cautious than optimistic.
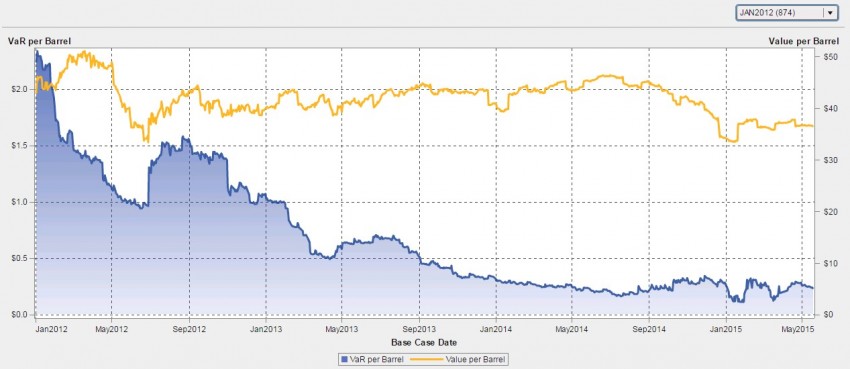
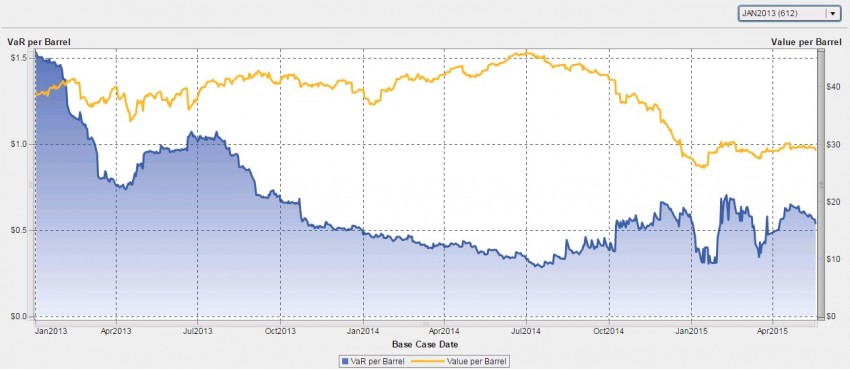
See below for additional visualizations of varying vintages. Join us back here each month to see how VirtualOil is performing and how the risk analysis is evolving.
Assumptions
The hypothetical derivatives-based oil production firm VirtualOil simulates the performance of a generic crude oil asset, and delivers sectorial exposure to the commodity oil market. Specifically, the VirtualOil structure starts up with an investment of $350MM in monthly average price call options with a strike price of $50 per barrel on the price of WTI light sweet crude oil. The strip of options starts at 10,000 barrels per day and extends out for 5 years with a 20 percent average annual decline in underlying notional barrels, replicating a physical oil asset. VirtualOil initially holds notional crude oil reserves of approx. 10MM barrels. Monthly cash flow is generated when the daily average WTI price relative to the preceding month exceeds $50 per barrel. Cash flow is reinvested monthly at 5 percent and the project winds up when the reserves are depleted.
VirtualOil is managed in SAS® BookRunner with reports surfaced in SAS® Visual Analytics. Learn more about SAS BookRunner’s state-of-the-art Energy Trading & Risk Management capabilities.
Disclaimer: This is a fictitious portfolio and is not a solicitation to trade.