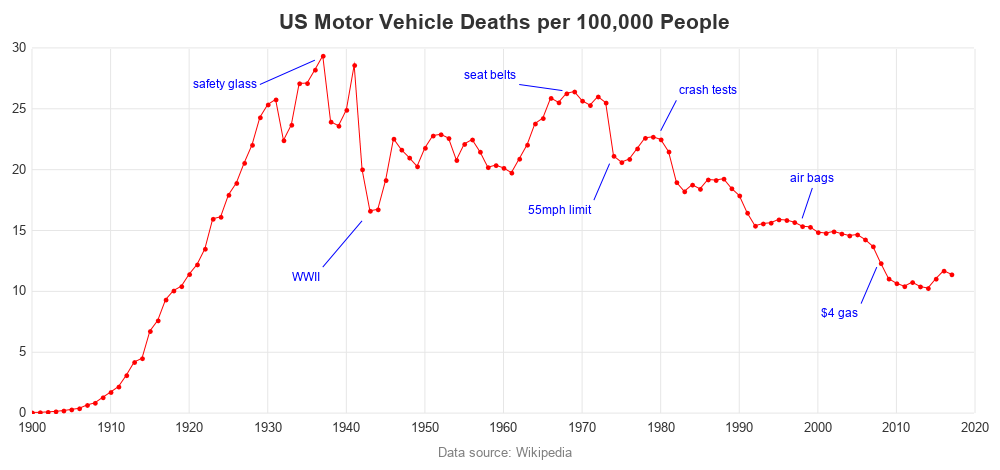
Are traffic fatalities up, or down?

I recently saw an interesting graph that showed the number of motor vehicle crash deaths has been going down. The graph showed deaths per mile. That's a good statistic, but I wondered whether there were other ways to look at the data? An Interesting Graph Here's the graph, from an