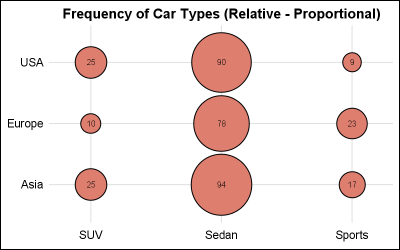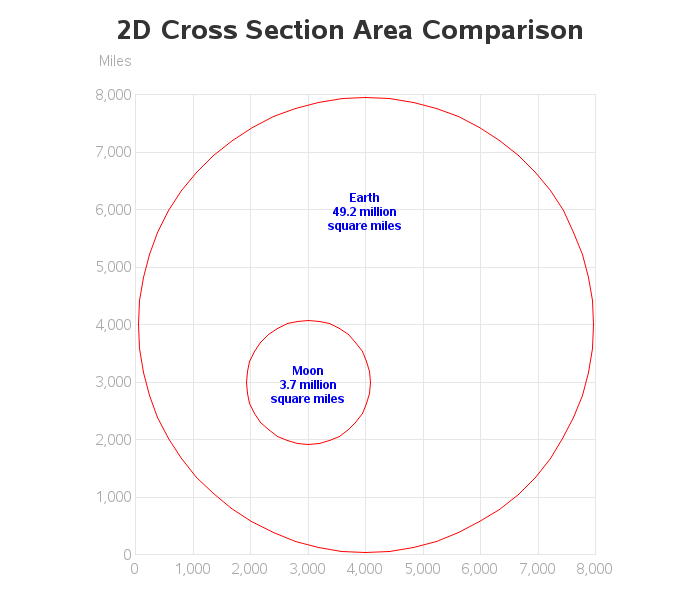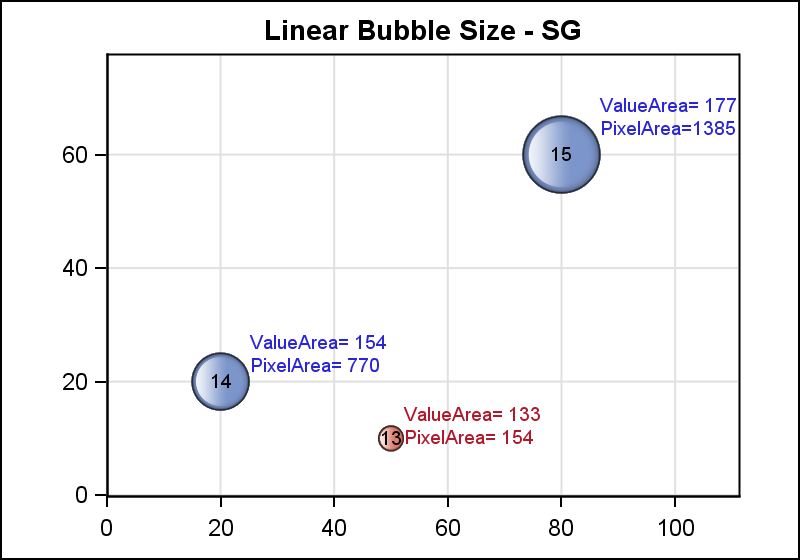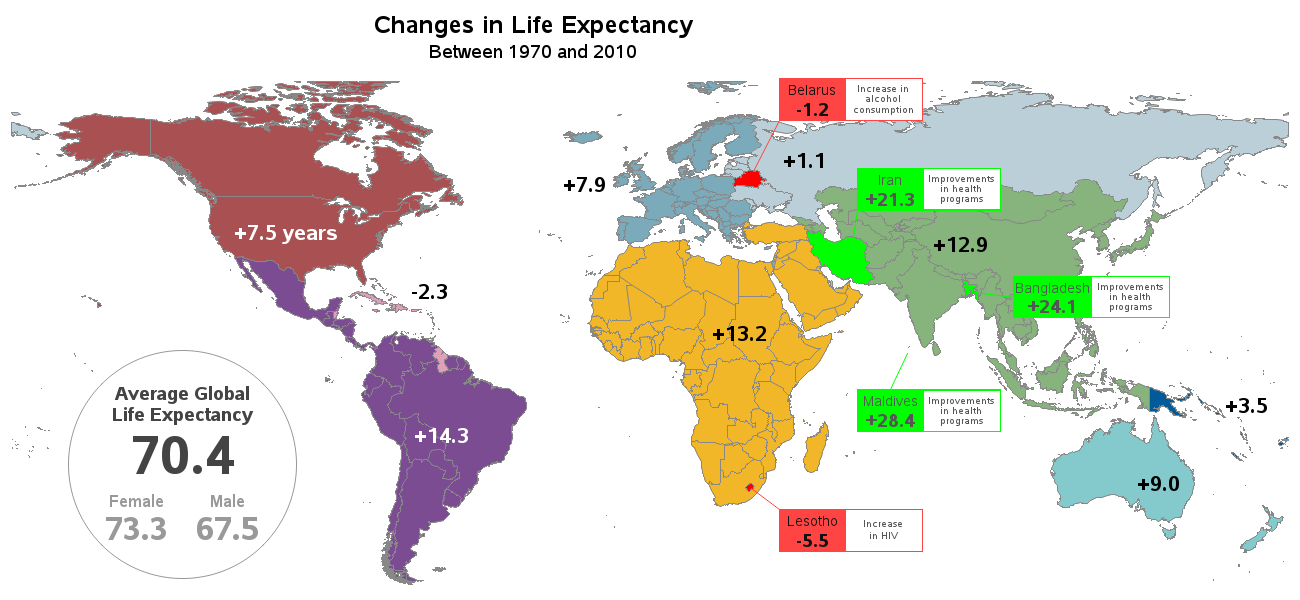
This is the 9th installment of the "Getting Started" series, and the audience is the user who is new to the SG Procedures. It is quite possible that an experienced users may also find some useful nuggets here. In this article, we will cover the basics of the BUBBLE plot.


