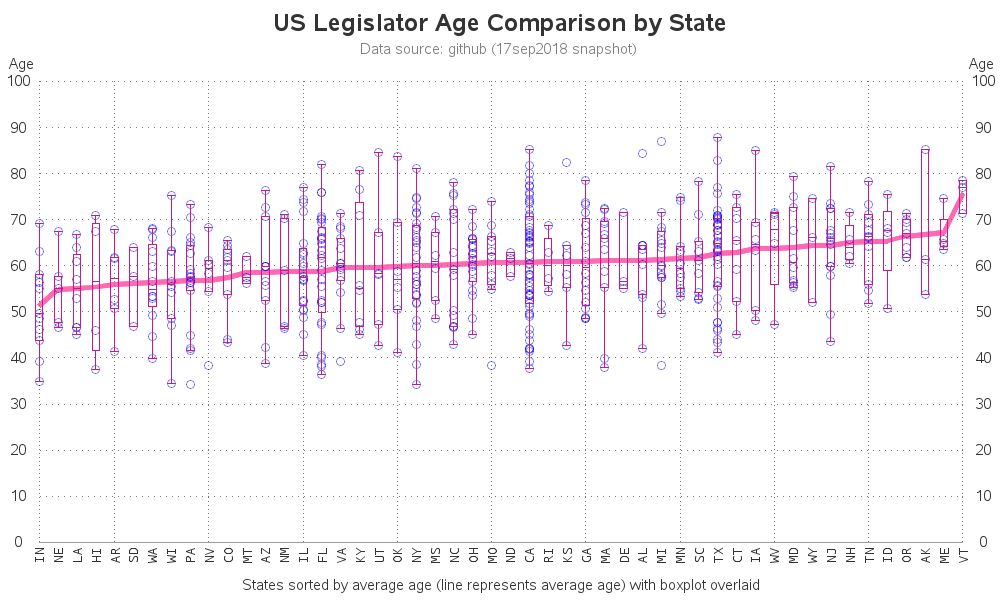
Have you noticed a lot of graphs popping up lately, about politicians, voters, and elections? ... Well of course - it's an election year! If you follow my blog posts, then you're probably a bit "smarter than the average bear" when it comes to scrutinizing graphs. And election graphs election
Tag: age
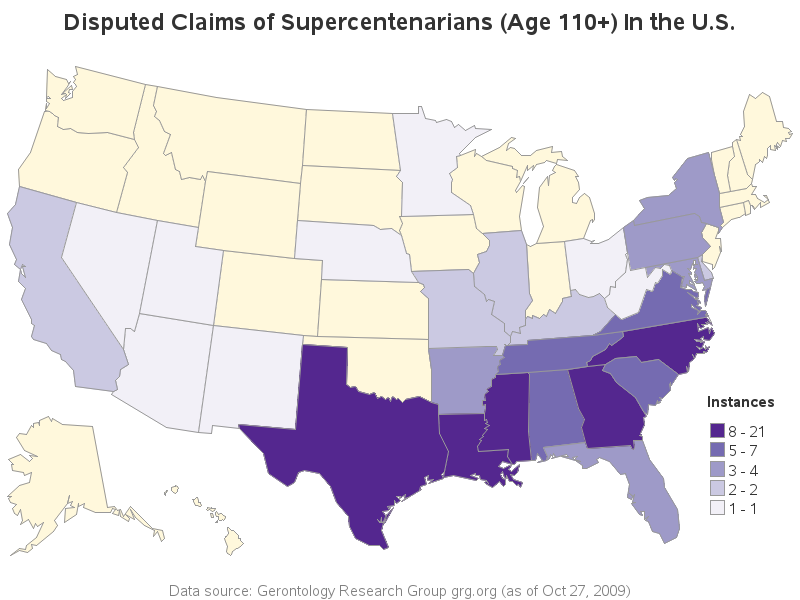
Have you ever lied about your age? When you were younger, perhaps you exaggerated your age to watch an R-rated movie, buy cigarettes, get into a night club, or drink alcohol? And when people reach their 30s or 40s, they might subtract a few years when people ask their age.
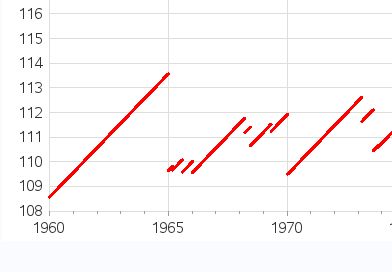
How old was the oldest person in your family, or the oldest person you personally know? And how do they compare to the oldest people in the world? ... Perhaps you can easily make the comparison, with this cool graph! But before we get started, here's a picture of my
I was recently reading the Wikipedia page about the U.S. presidents. There was a table with a lot of interesting data, but I thought it would be much easier to get a handle on the information if there was also a timeline graph. So, of course, I set out to
Donald Trump is pretty spry and energetic for an old guy - he's currently 71 years old, and seems to have more energy than I do (and I'm about 20 years his junior). But is he the oldest US president? Well, as with many questions ... it depends. Follow along
If countries have a similar median age, does that mean they are also similar in other ways? My best guess at an answer is - probably. Perhaps if we plot the data on a map, we'll be able to see the answer more clearly. I first started thinking about this
Recently, my fellow SAS blogger Rick Wicklin wrote a post showing how to graph the ages of all the US presidents. And Chris Hemedinger showed how to create a bar chart showing the number of presidents having each of the 12 zodiac signs. Both are interesting graphs, but I wanted to
Living to 100 isn't as simple as just paying a certain amount of money for your healthcare. But that is an interesting aspect of longevity, so let's have a look at the data ... In my previous blog post, we analyzed how much people from various countries spend on healthcare.
They say age is a relative thing. With this graph, you can tell how old (or young) you are, relative to everyone else. (I'll let you decide whether this is a good thing, or a bad thing, hahaha!) Nathan Yau recently posted a graph on flowingdata.com that allows you to
A honey bee can live for 8 years ... but a black garden ant can live even 20 years longer than that! Learn more details, and other interesting trivia, in this blog on "the longevity of things." I recently found The Animal Ageing and Longevity Database, and was fascinated by