SAS' Michael Lamm gives an overview of Bayesian Additive Regression Trees (BART) and demonstrates training and scoring BART models in SAS Visual Statistics.

SAS' Michael Lamm gives an overview of Bayesian Additive Regression Trees (BART) and demonstrates training and scoring BART models in SAS Visual Statistics.

Robert Blanchard's role as a data scientist at SAS has afforded him the flexibility to live where he wants, in his case, on a beach in San Diego.

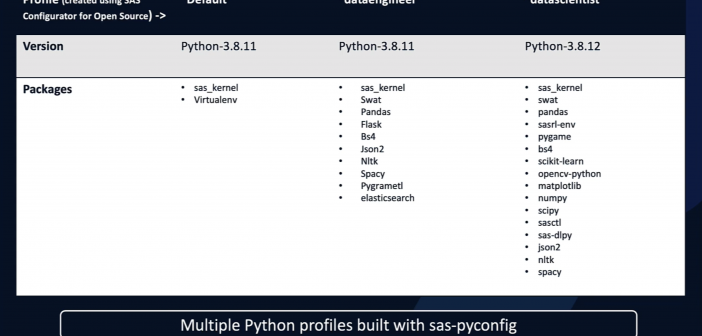
The Proc Python procedure, Python code editor & Python code step facilitate low-code analytics calling Python and SAS from a common interface. Data scientists also appreciate the connection to Python & R through the Model Studio Open-source Code node. Older methods of interaction include the swat and sas_kernel packages running on Python clients.

SAS' Ricky Tharrington and Jagruti Kanjia explain two ways bias shows up in model predictions.

The Vehicle Routing Problem (VRP) algorithm aims to find optimal routes for one or multiple vehicles visiting a set of locations and delivering a specific amount of goods demanded by these locations. Problems related to the distribution of goods, normally between warehouses and customers or stores, are generally considered vehicle routing problems. For this article's example, let’s consider a real (and awesome) brewery that needs to deliver beer kegs to different bars and restaurants throughout multiple locations.

SAS' Jordan Leiker shows you how any CAS action can be used with image data to create heat maps.

SAS' Hamza Ghadyali reveals how to build computer vision solutions with privacy baked into their design.

In the second of two Q&As with R&D colleagues, SAS' Udo Sglavo provides a window into how we approach drug-development challenges with machine learning.

Data visualization is a critical way for anyone to turn endless rows of data into easy-to-understand results through dynamic and understandable visuals. Whether your favorite visualization is a pie chart, a geographic map or relies on natural language, showing the insights that empower you to make more informed decisions is a better way to do data-driven business. Analyst firms say that SAS has market-leading data visualization. This helps users across the globe find insights in their data using new and exciting trends in data visualization.

A note from Udo Sglavo: At SAS, what we deliver to our customers is a product of creative minds thinking differently, challenging the norm, taking risks, and learning from trial and error (The greatest teacher, failure is). For the return of World Creativity & Innovation Week, we want to share