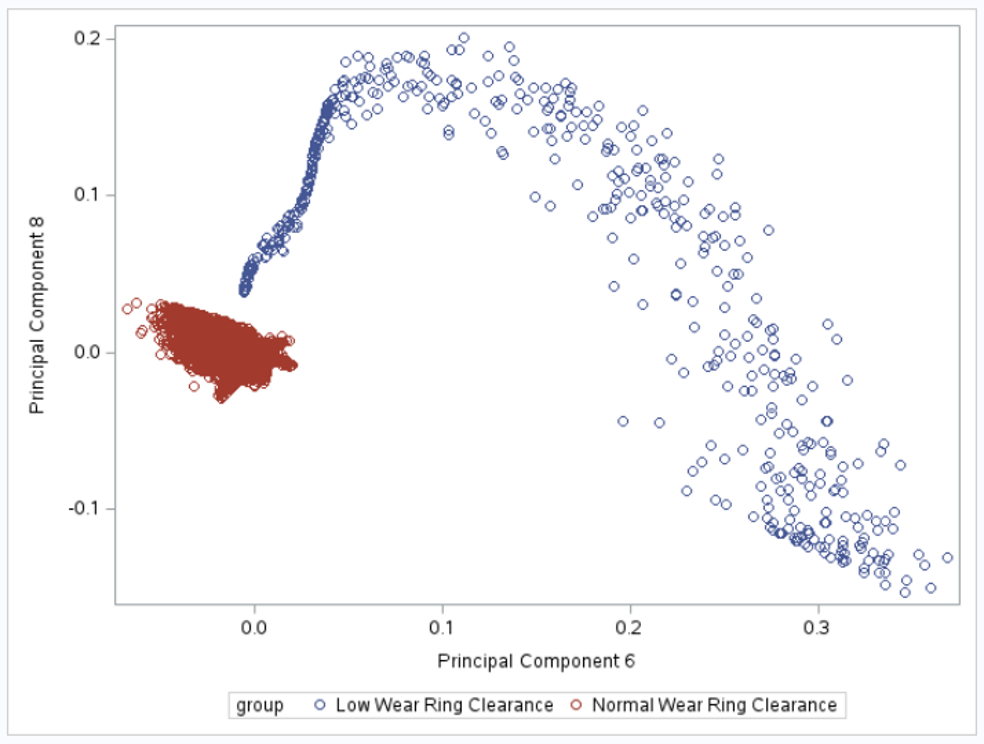
The advantage of using SAS PROC KPCA is that you can preprocess your data so that you can classify groups with nonlinear classification boundaries. The figure on the left shows two groups of data points that have a nonlinear classification boundary. It is impossible to draw a line that separates these two groups. However, the figure on the right illustrates that after we use KPCA to project the points into a higher dimension, the points can be separated linearly.
|
|
The ability to separate groups with nonlinear classification boundaries comes with a cost. To capture the nonlinear classification's local geometry, we must specify "how close to look at the geometry of the original space." In KPCA, a bandwidth parameter defines "how close to look" mathematically. The cost is identifying the appropriate bandwidth parameter to determine a solution that separates the groups well in higher dimensions. In practice, this is done either brute force through trial and error or cross-validation by trying a range of bandwidths and looking at the classification error of a downstream machine learning classifier (logistic regression, discriminant analysis, decision tree, neural network, etc.). The objective is to identify the bandwidth that minimizes some measure of classification error (misclassification rate, false positive rate, false negative rate, the area under the ROC curve, etc.). The disadvantages of using the cross-validation approach are: it may not be possible to identify a valid range of bandwidth values to try, and it can be computationally burdensome to run the classifiers for each of a large number of bandwidth values. SAS® PROC KPCA has a novel method of avoiding these disadvantages.
SAS® PROC KPCA has implemented the criterion of maximum sum of eigenvalues (CMSE) to address the bandwidth selection problem. SAS iterates over a wide range of bandwidth values for a subset of c points (centroids) chosen by k-means. It then applies the Nyström method to approximate the SVD solution efficiently. For each bandwidth value, SAS sums the eigenvalues and stores them. SAS then finds the maximum sum and chooses the bandwidth associated with the maximum sum. The bandwidth is chosen for the solution that explains the highest amount of variation in the original data based on the fact that the sum is maximized. Since the approximate Nyström method is applied to a subset chosen by k-means, the identification of the bandwidth can be performed efficiently in an automated manner. The time complexity is reduced from O(n3) to O(cn2) using the Nystrom method, where n is the number of observations in the input data set and c is the number of centroids identified by k-means. The following example shows how we can select the bandwidth using the CMSE method:
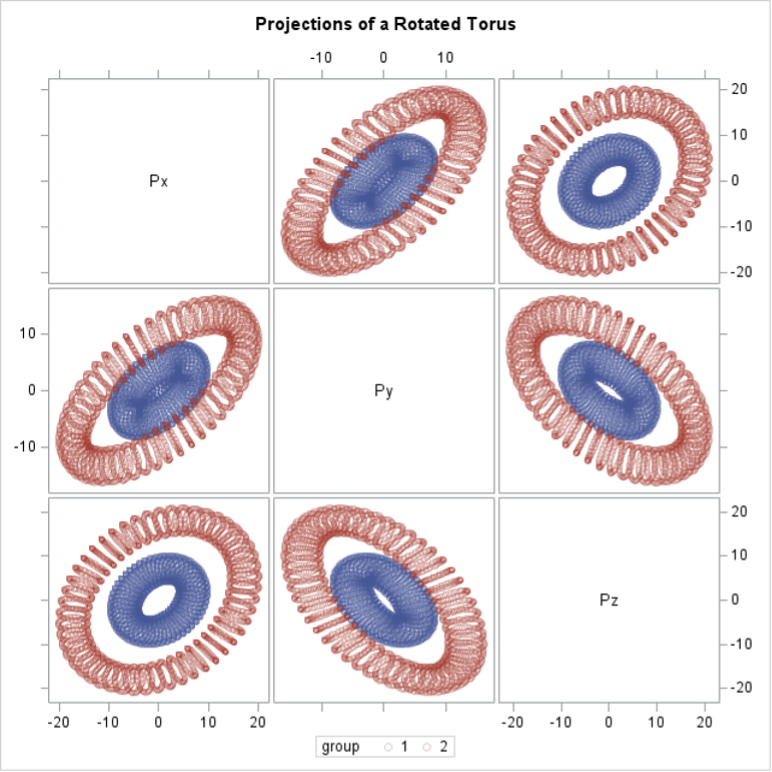
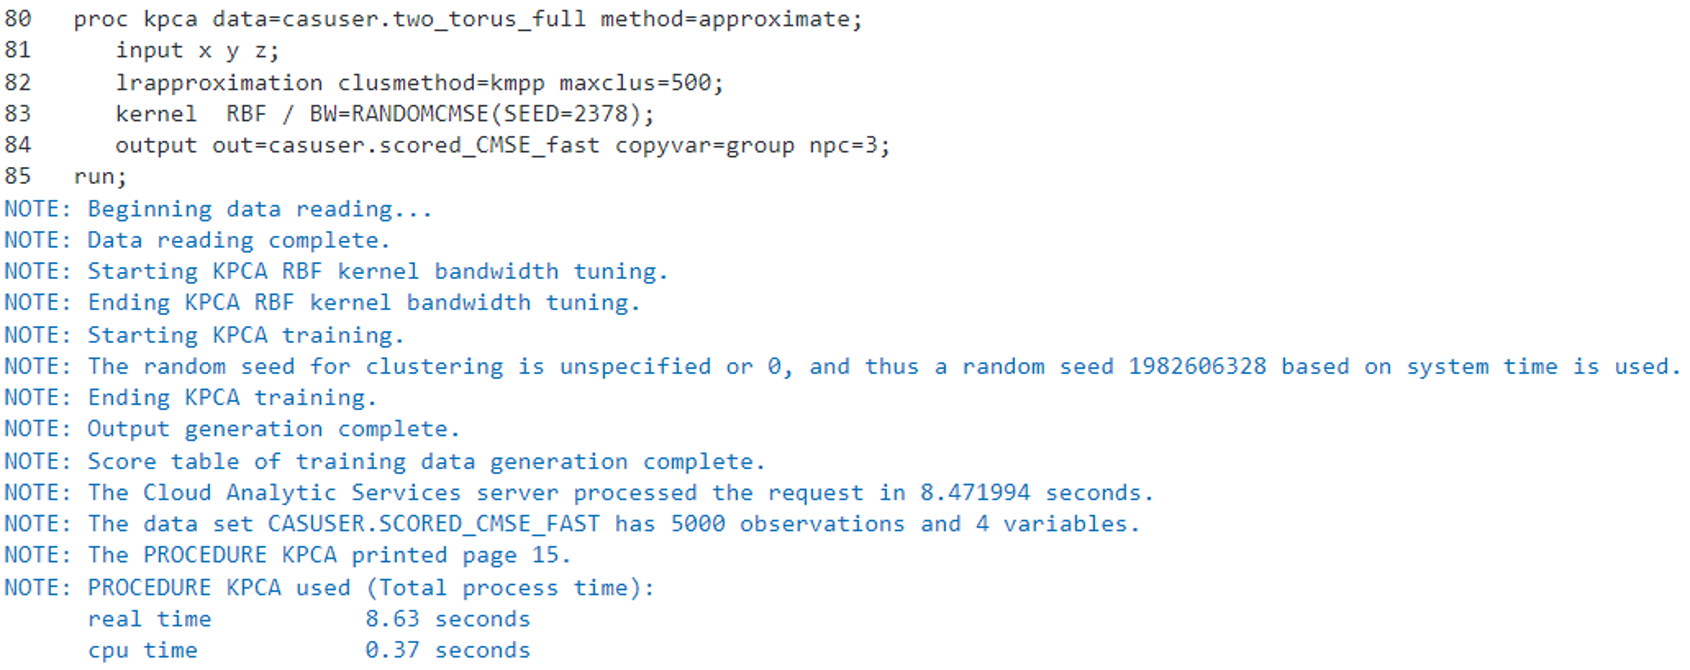
We are trying to separate two toruses into three dimensions for this example. The following graph shows different orientations of the toruses:
In the KERNEL statement, we specify BW=RANDOMCMSE so that the CMSE method is used to automatically identify the optimal bandwidth for three dimensions (NPC=3 in the OUTPUT statement). We also specify a non-zero seed to ensure the results are reproducible by setting (SEED=2378) as an option to RANDOMCMSE.
proc kpca data=casuser.two_torus_full method=approximate; input x y z; lrapproximation clusmethod=kmpp maxclus=500; kernel RBF / BW=RANDOMCMSE(SEED=2378); output out=casuser.scored_CMSE_fast copyvar=group npc=3; run; |
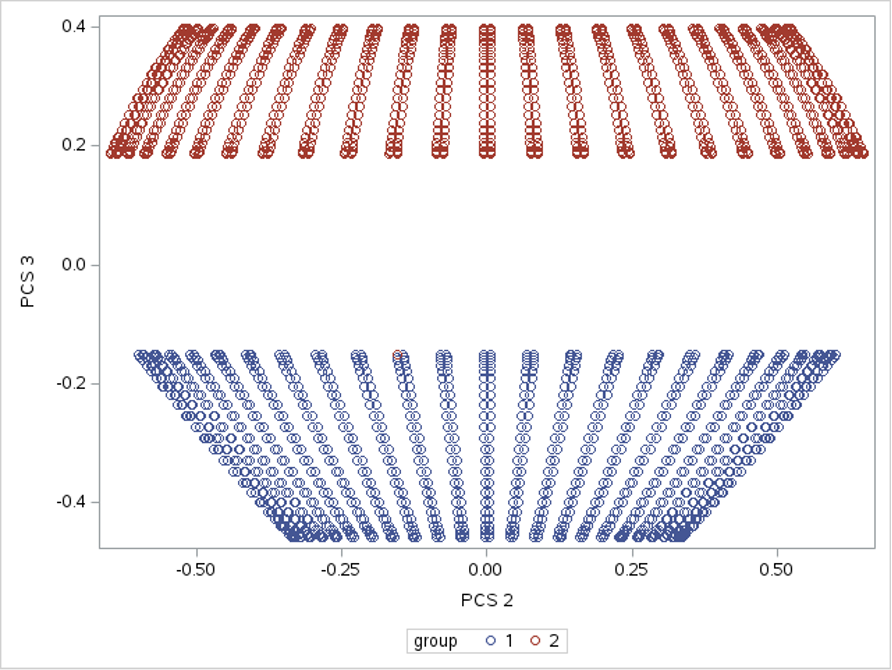
If we plot the 2nd and 3rd principal components, we can see that the toruses can be linearly separated:
The total time to run KPCA on five thousand observations with bandwidth identification and producing the principal component score is approximately 8.5 seconds. This is more efficient than using cross-validation to select the bandwidth parameter by looping around PROC KPCA multiple times.
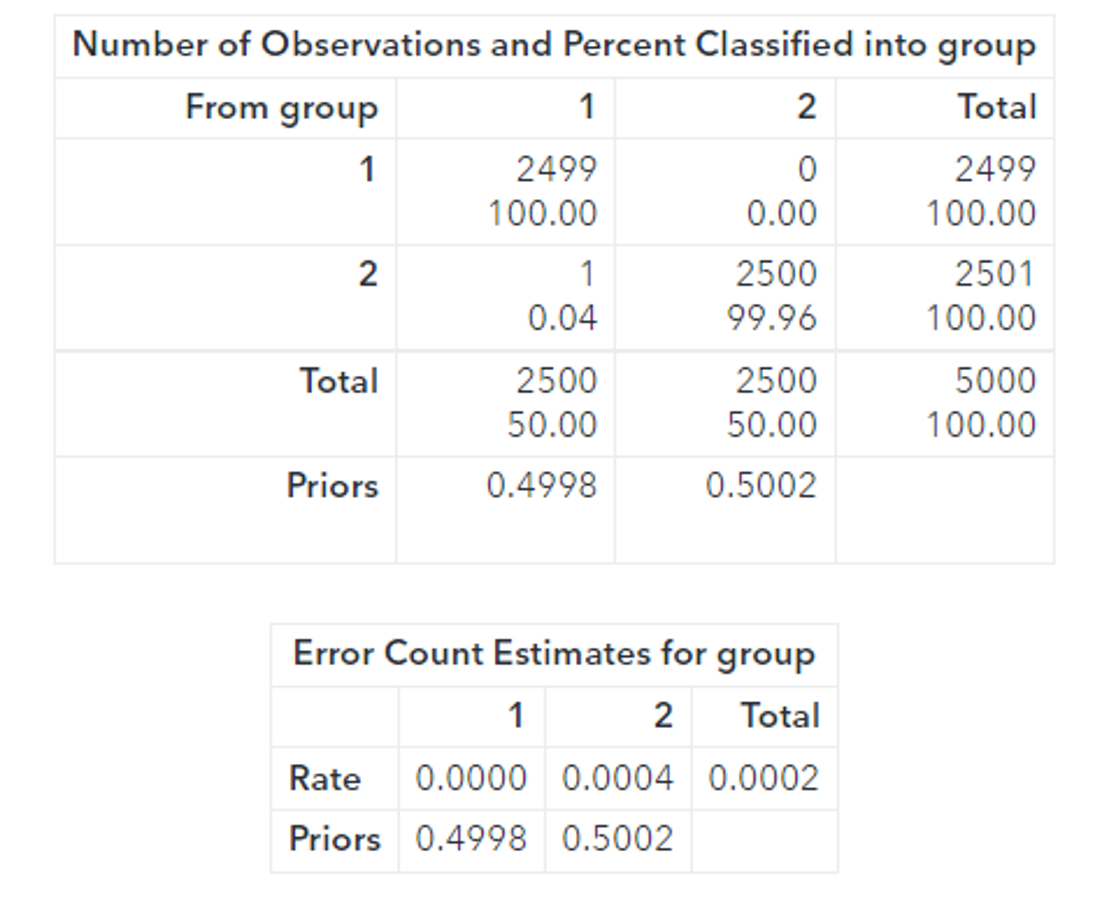
Running PROC DISCRIM provides further evidence that the toruses are linearly separable:
proc discrim data=casuser. scored_CMSE_fast method=normal pool=yes short; class group; priors proportional; run; |
The code in this article can be found on the public SAS® software Github at:
Check out my other blog article on SAS® Fast-KPCA.
References
K. Shen, H, Wang, A. Chaudhuri, Z. Asgharzadeh. Automatic Bandwidth Selection for Kernel Principal Component Analysis, Journal of Machine Learning Research 1 (2021) 0-00. December 2021.
M. Li, W. Bi, J. T. Kwok, and B. -L. Lu, Large-Scale Nyström Kernel Matrix Approximation Using Randomized SVD, in IEEE Transactions on Neural Networks and Learning Systems, vol. 26, no. 1, pp. 152-164, Jan. 2015.
SAS® Viya® Programming Documentation, Data Mining and Machine Learning Procedures, The KPCA Procedure, https://go.documentation.sas.com/doc/en/pgmsascdc/v_032/casml/casml_kpca_details03.htm
Wicklin R., The Do Loop, Visualize a Torus in SAS. Visualize a torus in SAS - The DO Loop