
A few months ago, I published an article about network optimization and how to find an optimal tour when visiting multiple places of interest by using different types of transportation, like buses, trains, tram, metro, and even walking. For a real-world case, I decided to run these optimal tours in my favorite cities including Paris, London, Madrid, and Lisbon. I also recorded a video showing the code, development process, and resulting visual outputs. You can find these videos and additional resources at the end of this article. These videos were also shared on social media, particularly on LinkedIn, which led to today's new article.
One of SAS' most passionate enthusiasts, Michelle Homes, founder of Metacoda, reposted the video. We talked about running an optimal tour in Brisbane, where Michelle lives. Coincidentally, the SAS Visual Analytics guru, Falko Schulz, also lives in Brisbane (it seems all the cool people live there). I met Falko virtually during a project last year on mobility tracing; specifically about how to use network analysis and machine learning models to identify new outbreaks in COVID-19.
For my original four optimal tours (Paris, London, Madrid, and Lisbon), I used SAS to import public transportation open data, create a network, set up all possible paths, search for the optimal tour, and minimize the distance walked. To visualize the results, I used an open-source map package, Leaflet.
When Michelle and I started talking about a tour for Brisbane, I immediately thought about Falko. I knew he would never agree with not showing the results in SAS Visual Analytics. So, I had to ask for his help.

The entire process was pretty straightforward. I found the open data for Brisbane through their City Council web site, downloaded the public transportation data in GTFS format (similar to the data I used for my other tours), selected a hotel, 30 places to visit (of course, several breweries), and created a network with all possible paths. Based on that, I used the SAS Network Optimization procedure to calculate the optimal tour (TSPS – Travelling Salesman Problem algorithm) and the shortest path between any pair of locations. The possible types of transportation include walking, train, tram, ferry, and bus. The final tour may consider all possible types of transportation depending on the points of interest selected.
The first step is to select the places to visit. Perhaps because of the pandemic and being isolated at home for so long, I selected a lot of breweries... Actually, I don't think my choices would be much different after the pandemic anyways.
Here are the places:
data places; length name $40; infile datalines delimiter=","; input name $ x y; datalines; W Brisbane, -27.46980, 153.02208 All Inn Brewing CO, -27.363624029147324, 153.07469172216602 Aether Brewing, -27.391325436201726, 153.07493448800423 Stafford Tavern, -27.414314818822874, 153.01892808895582 The Village Social, -27.402276197706477, 153.06065023631763 Fick Brewing Co, -27.38722870810248, 153.06894979341186 Hub Brewing, -27.366211348260375, 153.0582404306849 Ballistic Beer Co, -27.54067875523543, 153.0439860027476 White Lies Brewing, -27.557792688284245, 152.93400522845363 Slipstrem Brewing Co, -27.524183405527967, 153.01913767503686 Three Brews, -27.517142554424538, 153.06951562721096 Lone Pine Koala Sanctuary, -27.533620, 152.969169 Mount Coot-tha Botanic Gardens, -27.475593, 152.976318 Gallery of Modern Art, -27.470258, 153.017620 The Popular Beer, -27.440850247418112, 153.04675056184303 Moreton Island, -27.438887, 153.109081 Museum of Brisbane, -27.46866, 153.02363 The Courthouse, -27.517395, 153.287654 Bacchus Brewing Co, -27.526797820619418, 153.21580810496778 Sirromet Wines, -27.584248738787608, 153.25284528352609 Tapd Bar Ipswich, -27.607431751332264, 152.81657594774 Jacobs Creek Wines, -27.559968872365328, 153.05516166406093 Wine & Lader Bistro, -27.445758253426032, 152.9776908981407 Ipswich Nature Centre, -27.618348929729663, 152.76812549097824 Riverheart Parklands, -27.611537959824368, 152.76354239654248 Shucks Bar, -27.45349663758444, 153.18639339289905 Cannon Hill Tavern, -27.45551490180004, 153.10837538000447 Brewhouse Brisbane, -27.48367854420527, 153.02928786931474 Black Hops Brisbane, -27.47994872497054, 153.0422946404698 Wine Experience, -27.46456301173907, 152.99758593624773 Regatta Hotel, -27.4805240334964, 152.9965497 ; run; |
The following screenshot shows all the places visualized using SAS Visual Analytics:
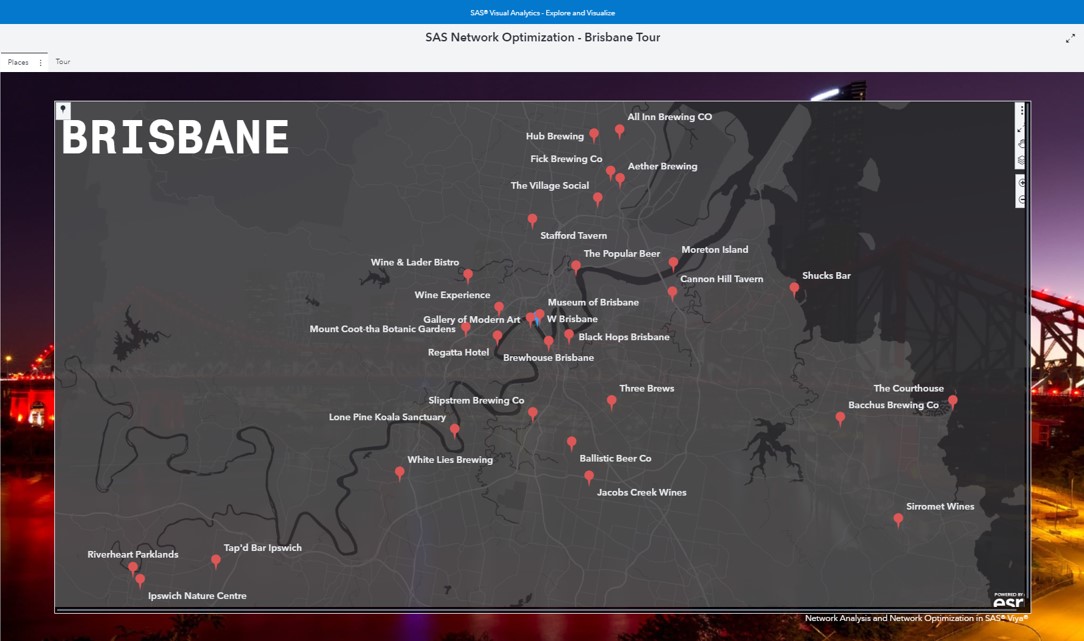
I need to start the tour at W Brisbane hotel, stop at all 30 places I selected, and return to W Brisbane hotel sober, or at least, alive. I want to minimize my time travelling. Different from my previous four tours, I have added Brisbane's bus lines, which dramatically increased the network's size by adding more links among locations and stops. To be fair with each type of transportation, I used an average speed for walk, bus, train, tram, and ferry. All distances among locations and stops were computed based on the geodesic distance in kilometers. Then, the average speeds were set as 4 km/h for walking, 16 km/h for trams, 18 km/h for buses, and 20 km/h for ferries.
Just some figures about the project. A dataset with the timetables for all lines, considering buses, trams, trains, and ferries, has over 2.3 million records. Aggregating the timetables by stops and lines results in a network with 26,000 links, comprising almost 9,000 nodes. In addition to that, I need to know the closest stops for each location. I could use all possible combinations between the 31 places and the 9 thousand stops. However, to minimize the complexity, I only selected the 50 closest stops to all 31 locations, which gave me another 1,550 links. I now finally have all possible 930 links between all 31 places of interest, considering the fact that I can cover some of the places by walking. This gives me a total of over 30,000 links in my network. Don’t worry, this is a piece of cake for the SAS network optimization procedure.
Once I have my network, I can compute my optimal tour.
proc optnetwork direction = directed links = casuser.placeslinks outnodes = casuser.outnodesTSP; linksvar from = org to = dst weight = distance; tsp cutstrategy = none heuristics = none milp = true out = casuser.outTSP; run; |
The outcome from the TSP algorithm gives me the right sequence. I just need to adjust that sequence and make sure I am starting at W Brisbane hotel and ending the tour at the same place (God help me after all those breweries).
Once I have the best sequence, now I need to search the shortest path for each step in my tour. As there are many possible routes, using multiple types of public transportation, and even walking, the shortest paths aim to minimize the time, according to the average speed defined previously.
proc optnetwork direction = directed nodessubset = casuser.nodes links = casuser.links outnodes = casuser.outnodesSP; nodessubsetvar node = name; linksvar from = org to = dst weight = time vars = (_all_); shortestpath outpaths = casuser.outSP; run; |
Combining the results of the Travelling Salesman Problem and Shortest Path algorithms, I have the final optimal tour for Brisbane to minimize the overall travelling time.
The results in SAS Visual Analytics can be seen here:
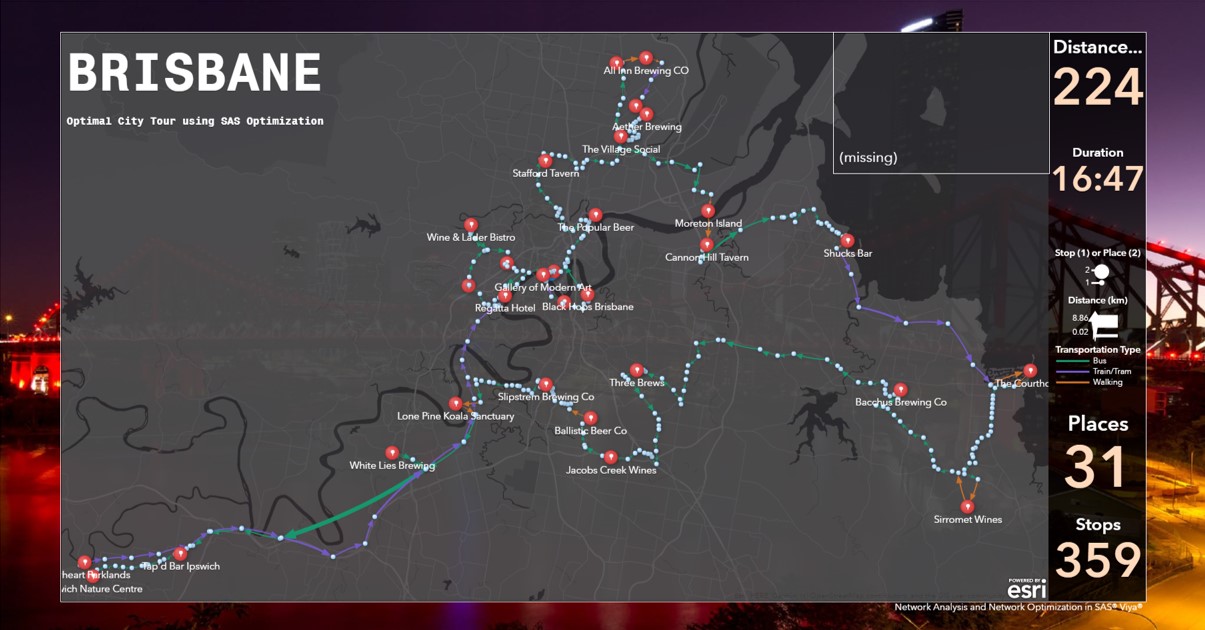
As you can see, this is a pretty long trip. To walk, I have to take several buses, trams, and trains. Fortunately, I don’t need to take the ferry, especially on my way back to the hotel, for obvious reasons, as three-quarters of my points of interest are breweries.
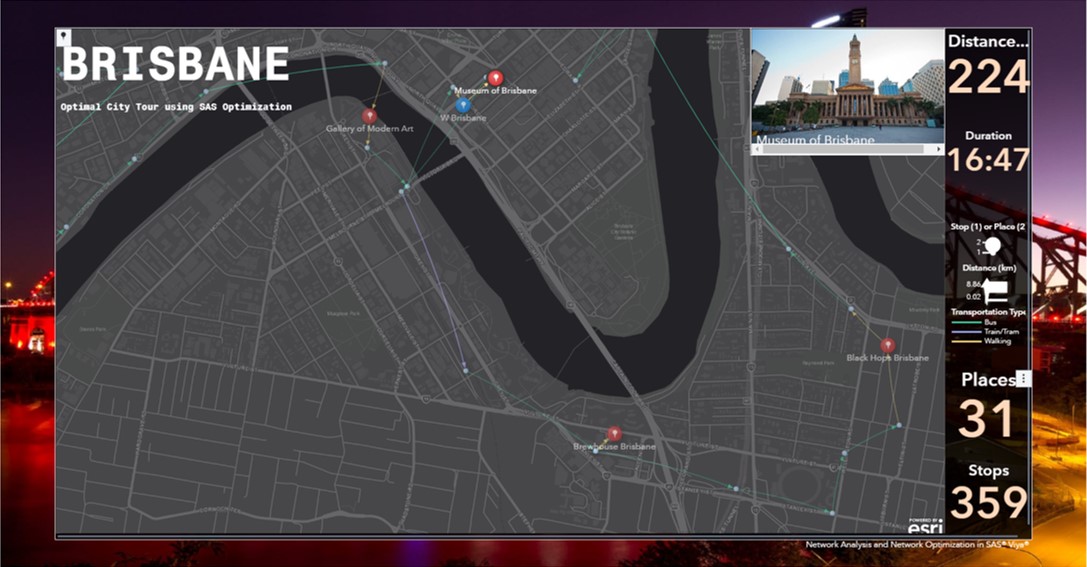
Different types of transportations are colored differently: Orange for walking, green for buses and purple for trams and trains. I can accumulate and aggregate some metrics directly in SAS Visual Analytics and present them as Key Values. I can also differentiate points of interest from stops and stations using distinct icons. In total, I cover a massive of 223.52 kilometers. Using public transportation, I can make it in 16.7 hours (apart from the time I will spend on the points of interest, in some much more than in others obviously). This is a huge trip. Maybe I should split this up over the course of a week.
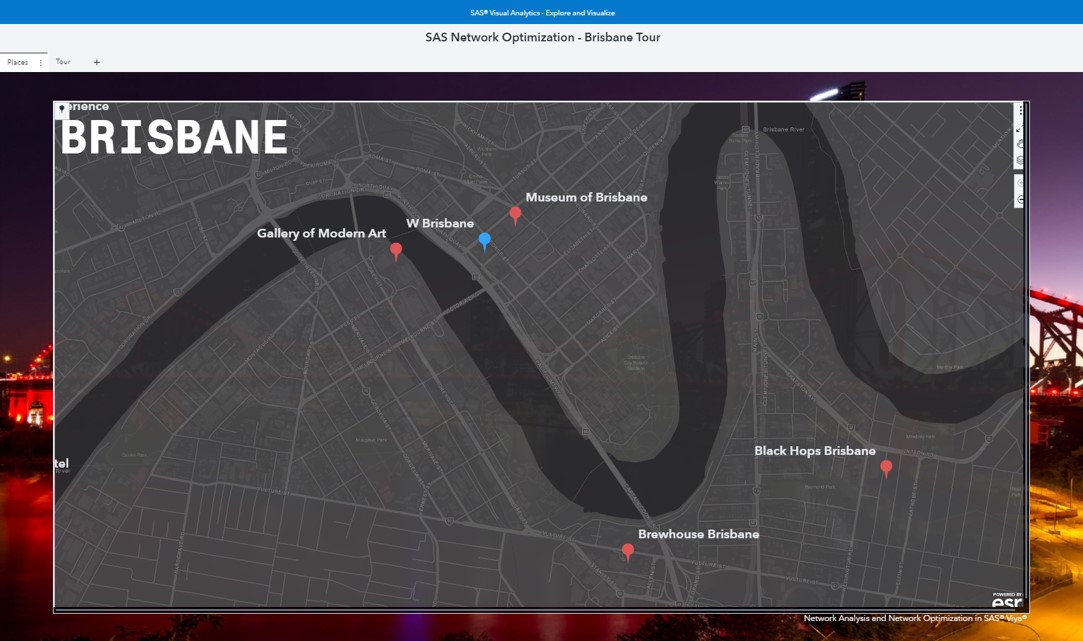
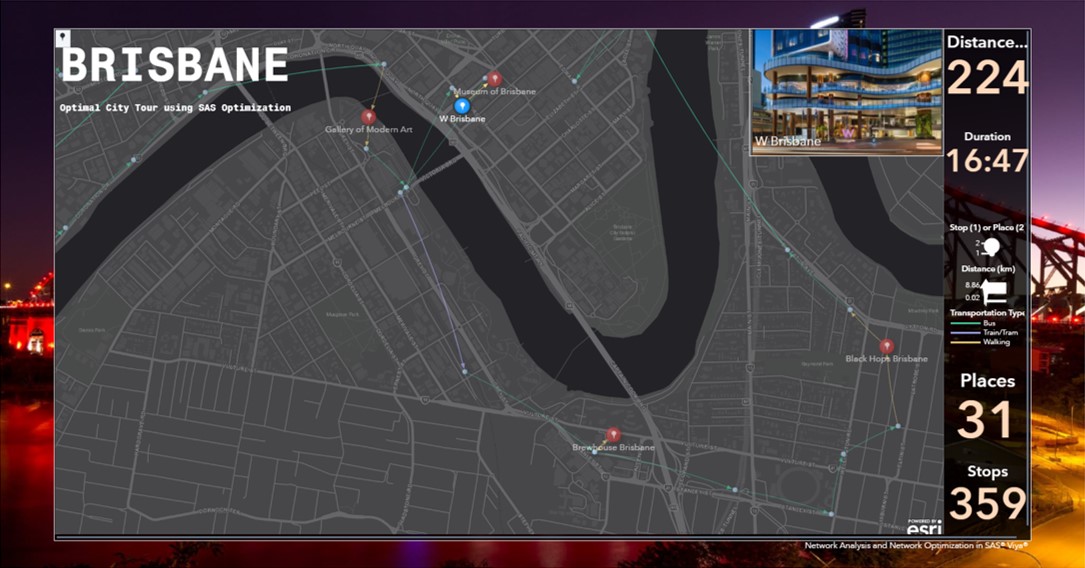
A nice feature in SAS Visual Analytics is the option to add pictures and additional info about the places you are visiting along the tour. For example, I am starting my tour at the W Brisbane hotel. In the following screenshot, you can see a picture of the hotel in the upper right corner. This feature provides users more information about what they are about to experience.
From the W Brisbane hotel, I go to the Museum of Brisbane. Again, a picture of the museum is just a nice touch to give users more info about the tour.
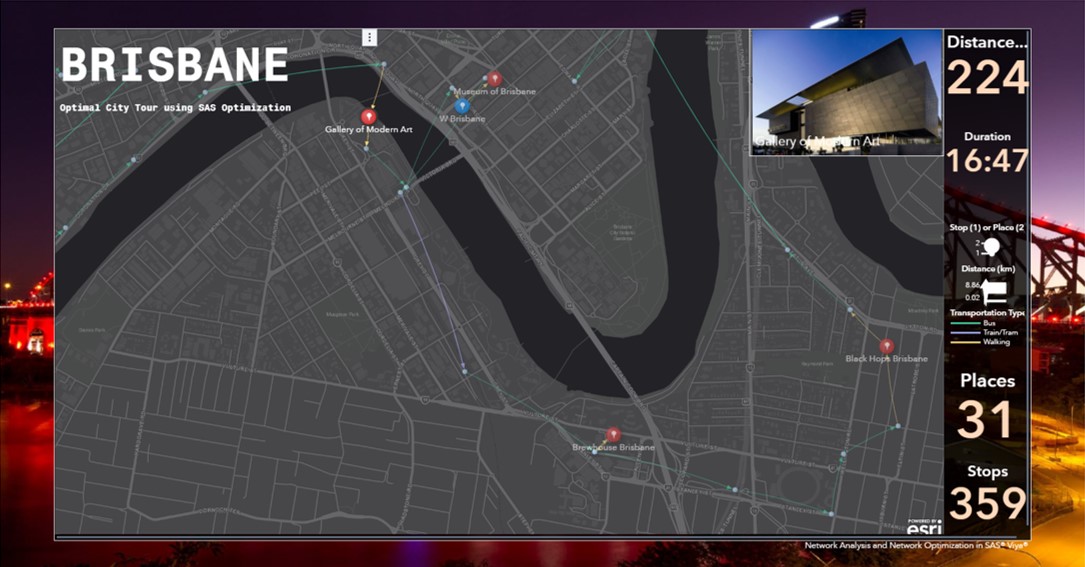
Then, 5-7 minutes later, I go to the Gallery of Modern Art.
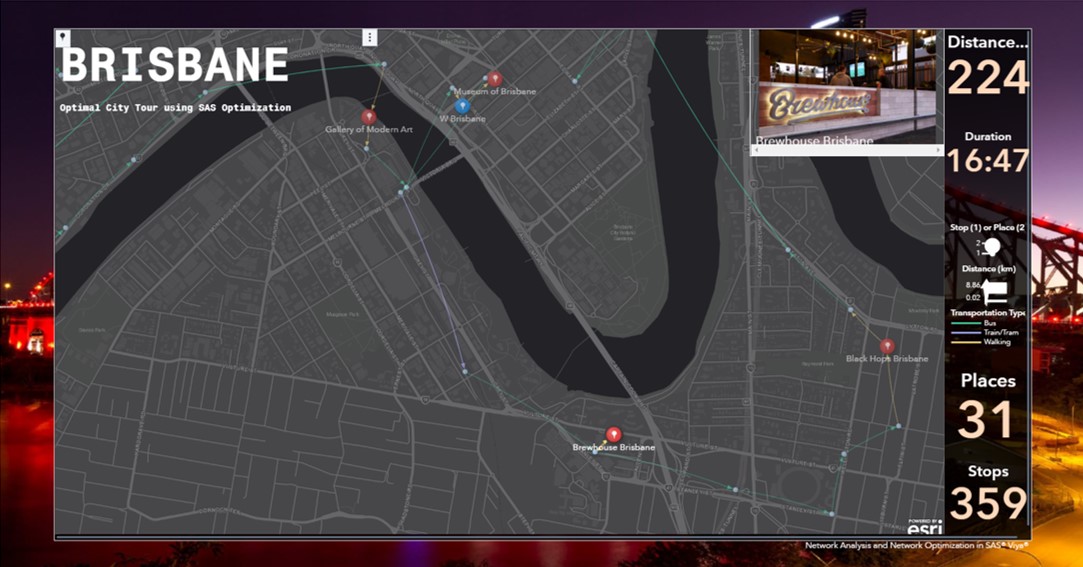
After 3-4 minutes, I depart to Brewhouse Brisbane (and then start all my problems).
The tour keeps going. After 40-50 minutes, I go to Black Hops Brisbane.
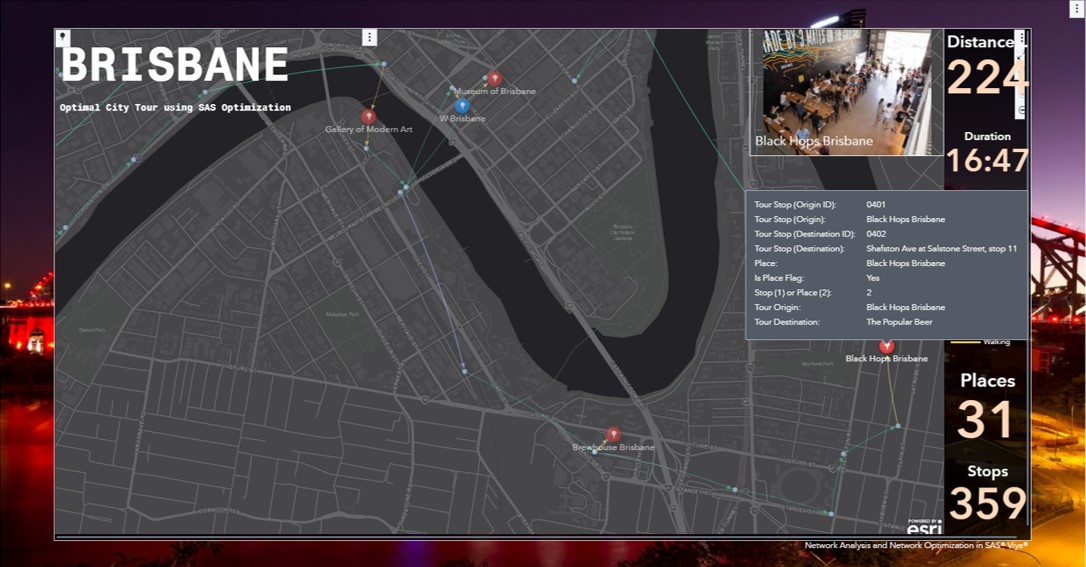
After 30-40 minutes, I keep moving. By this time, I can’t remember the next stop, but I can trust in my optimal tour. And I rely on the Place Image and Data Tip Values to give me detailed information about my next steps. Perhaps I just need to add some alerts to the application forcing me to leave some specific places to eventually finish the tour.
By (hopefully) finishing the tour, I was able to cover all 30 places (departing and arriving at W Brisbane hotel). I passed by 359 stops, considering trams, trains, and buses!
Since I have never been to Brisbane, I had to search on the Internet for all these places to go. But after running this project, I can’t wait to do this tour in person... Strictly to check out the performance of my optimization model, of course!
Thank you for reading! To see my optimal tours in different cities, please check out these videos:


4 Comments
YAY!!!! I'm so excited to see your article and the optimal journey! I'm hoping to check out a few of these places with Falko now.
Great to see Lone Pine Koala Sanctuary is amongst the places to visit. It's my favourite place to take visitors!!!
I look forward to escorting you to these places in person when you visit Carlos and thanks for including Brisbane in your city optimization problem. With the Brisbane river and many travel routes, you showed it is possible and seamless with SAS Network Optimization procedure to get an optimal route.
Great post Carlos. I have a question though. From the example above the distance between points calculated appears to be "as the crow flies" or "direct-point-to-point" and does not take into account for example the twists and turns in roads etc. How would one factor those finer details into the solution?
Thanks Gerrit. You're correct. I have calculated the Euclidian distance between any two points (places/stations/stops). Some packages like Google, Mapbox and Leaflet have the option to calculate route distances, considering current streets and roads. I heard SAS Visual Analytics also has this option when integrated to ESRI. I haven't use it though.
Pingback: Vehicle Routing Problem - A beer distribution example in Asheville - The SAS Data Science Blog