SAS Viya is great for coding in open source languages. Don't believe me? Then check out my previous blog on machine learning with R (and check back later for data science in Python on Viya). An area I haven't touched on yet is integrating open source and SAS 9.4. But, the wait is over! I would like to introduce SASPy, the package for building a bridge between SAS 9.4 and Python. Some of you may be saying "Well, wait SASPy is nothing new to us 9.4 natives!" Which is true. SASPy has been on GitHub since 2015. And numerous blogs have been written about SASPy. This blog will expand on their work and will be focused around using SASPy for machine learning.
Accompanying this blog is a Jupyter Notebook on Machine Learning using SASPy on the SAS Software GitHub Page. This notebook goes more in depth and includes several helpful code snippets for building logistic regressions, decision trees, random forests, confusion matrices, ROC Curves, and Area Under the Curve(AUC) calculations, so check it out as you read this blog.
Getting Started with SASPy
Using SASPy requires a license to SAS 9.4. Once you have this license, you can install SASPy using pip install. The next steps for using SASPy depend on your SAS 9.4 environment. If you have SAS 9.4 installed locally on your computer, you can simply run SASPy's auto-configuration function. For any other environment, you can follow the instructions in the configuration guide.
Once you have installed and configured SASPy, you can import SASPy like any other python function. Next, you create your SAS Session.

Next we want to create a SAS library, which is where all my data is stored.

Now that I have my library, I can load my data.

Exploring Data
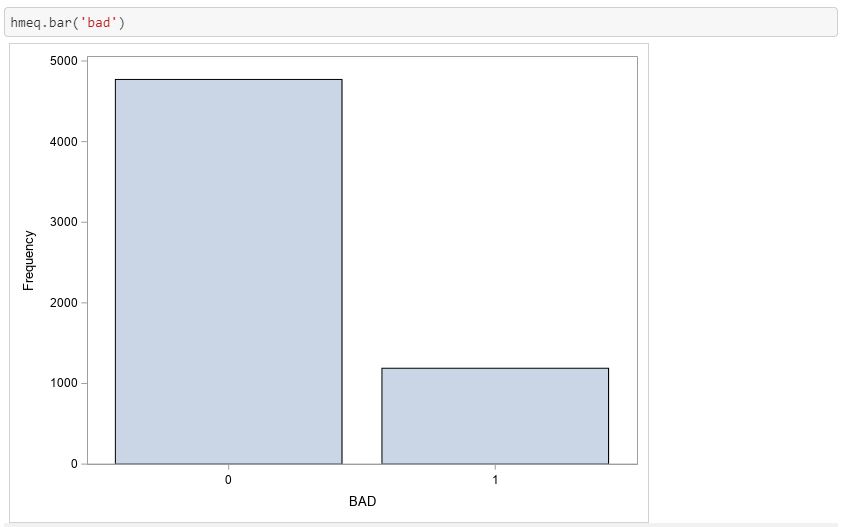
SASPy allows you to explore data stored in SAS from a familiar Pandas syntax. Python programmers can still use the head(), bar(), and describe() functions, as well as many other functions.
Learning and Running SAS
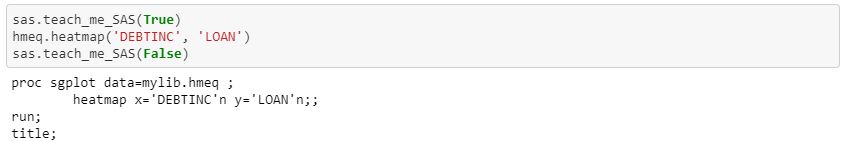
If you are interested in the corresponding SAS code for the SASPy functions, including those resembling the Pandas syntax, you can use the teach_me_SAS() function.
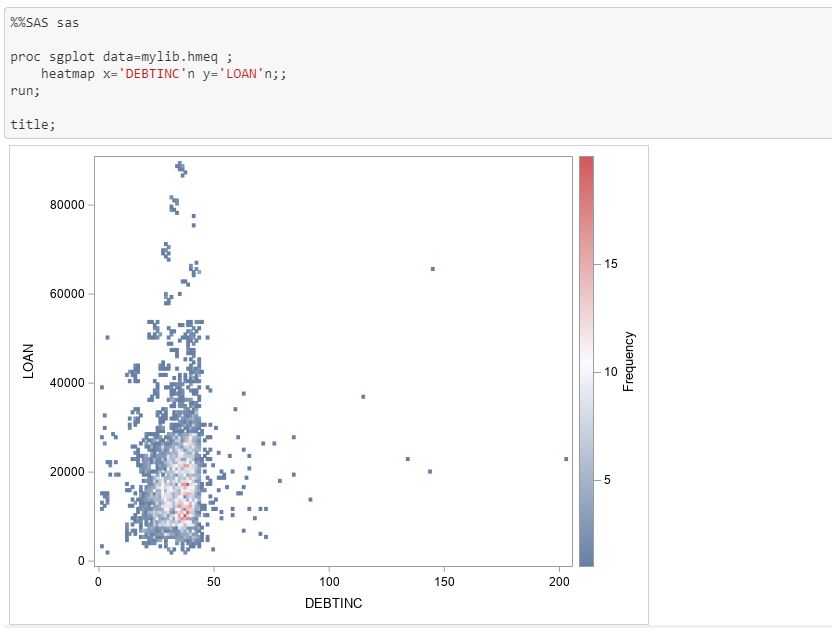
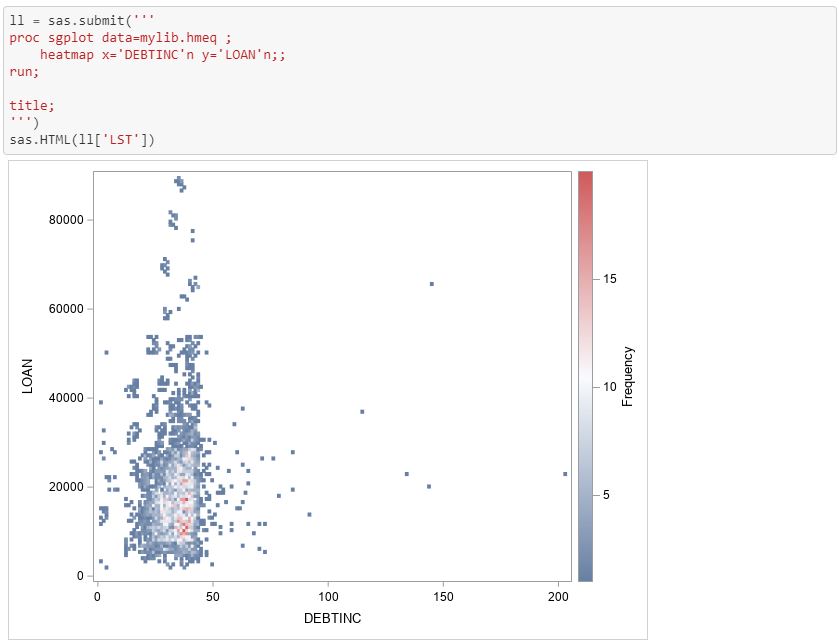
To run SAS code in a cell, you can use the SAS cell magic in Jupyter Notebook, denoted by %%SAS session_name, or the submit function.
Since we are running the same functions, the outputs are identical.
Analytical Modeling
To use your product packages, you must first load the packages. You need to invoke your SAS session to grab the products you want to use. From SAS/STAT you can create a logistic regression and a decision tree and from SAS ML you can create a random forest. There are many other options available within those packages as well!

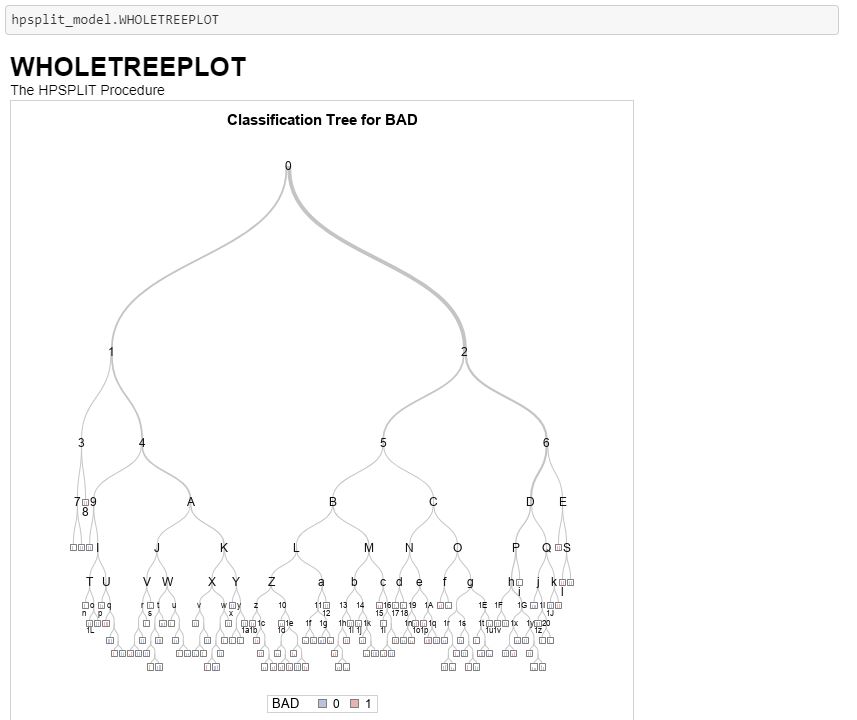
After the package is loaded, you can use these packages to build models and view output.Here I am building a decision tree to classify bad loans. I am using the SASPy equivalent to PROC HPSPLIT to build a decision tree. In addition, I am saving my scored data to use for model assessment and comparison. I have already created a partition in my data, which I will use to separate my data into training and testing.
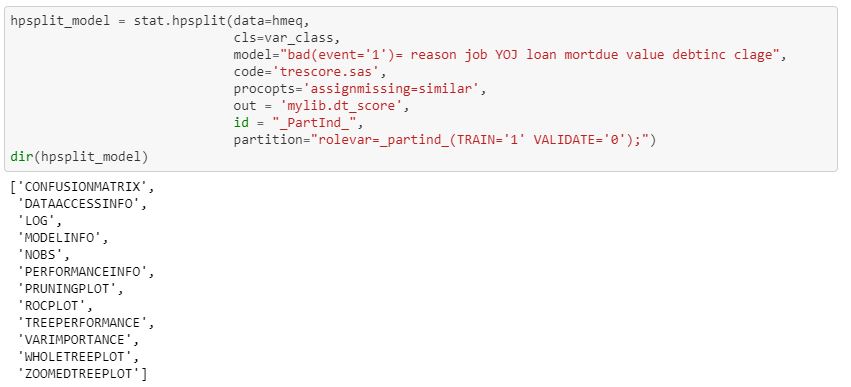
Once the model successfully runs, a list of results are returned. The results can easily be accessed and viewed to better understand the model.
Comparing Models
After creating several models, we want to know which models performed best on the test data set. I brought my result data into a Pandas data frame to make comparison with Python models much easier. It takes one line of code to convert a SAS data set into a Pandas data frame.

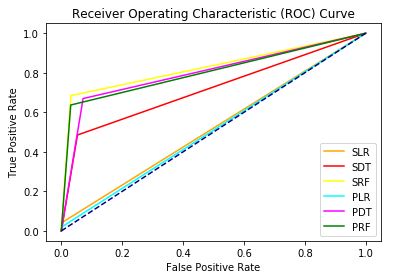
In my notebook, I created six models in total: three using SAS packages and three using Python package. These models included a logistic regression, a decision tree, and a random forest. I created a ROC Curve to compare all six models together. To improve readability, I abbreviated the model names such that SAS models began with a S and Python models began with a P. The ROC Curve below shows similar bad performance for the logistic regression, but much better performance for the tree based models. The SAS Random Forest Model is the champion model with an AUC of 0.83.
Conclusion
In this notebook we harnessed the power of SASPy to use SAS procedures from a Python syntax, reducing the silos built between Python programmers and SAS programmers while giving analysts a choice in programming languages. For more information on SASPy, please see the SASPy documentation, the SASPy GitHub page, and the SASPy example notebooks. In addition, my Jupyter Notebook, which includes several helpful code snippets for building logistic regression, decision trees, random forests, confusion matrices, ROC Curves, and Area Under the Curve(AUC) calculations, is available on GitHub!