I'd like to introduce you to endocrine-disrupting chemicals (EDC), and to the CDC NHANES government data source for examining the relationship between EDCs and their impact on the human body.
For my research project to complete my Master of Science in Analytics (MSA) degree, I delved into the area of endocrine-disrupting chemicals. This was an entirely new area for me. I was inspired to learn more after I met Dr. Melissa Strong of IndiOmics, a company that helps consumers understand their exposures to common chemicals, and then recommends lifestyle modifications to minimize that exposure. (To learn more about IndiOmics, watch the video in the References section below.) Dr. Strong gave me a quick overview of EDC and how they were present in my everyday life, often without me recognizing their presence. Thus began my quest to understand how EDCs potentially impact our bodies. Let's break this down further.
Watch a video about IndiomicsWhat is the endocrine system?
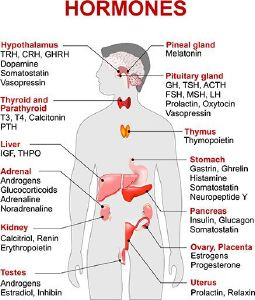
The endocrine system is a series of glands in our bodies that produce and discharge hormones, which are absorbed into the bloodstream. The hormones contain the operating instructions for the cell. These instructions influence everything from our digestion and metabolism to how we breathe and sleep, and even how we reproduce. These glands and the hormones that they produce are shown in Figure 1. As you can see, hormones play quite a big role in the body's ability to function normally.
What is endocrine disruption?
Endocrine disruption is essentially a disturbance in how our hormones normally work due to the exposure to a synthetic chemical or family of chemicals. This interference may result in adverse effects to our bodies and show up as disorder or disease. I’m going to reach way back into my biochemistry days to provide an easy explanation regarding how our cells respond to these EDCs.
Let’s start with how a cell works. Certain cells (e.g. a breast cell) have hormone receptors on the surface which are eagerly awaiting instructions from substances in the bloodstream as to what the cell should be doing. Ideally, the correct substance comes along and gives appropriate communications to the hormone receptor such that the cell operates normally. Think of this as the happy path.
But in the case of EDCs, the hormone receptors receive inappropriate communications and the cell does not behave as it should. The EDCs are close enough to the chemical structure of the hormones, that the cell accepts the instructions from the EDC, when indeed it should not do so.
When a synthetic chemical disrupter enters our body, it can throw off our hormonal balance by invoking a response from the cell that is more or less powerful than coming from the normally occurring hormone or it can create a totally new and different response. For example, a breast cell may respond to an EDC because it mimics the estrogen hormone and receives instructions (improper) to grow like crazy.
What are the endocrine-disrupting chemicals in our environment?
You should be aware of these common EDCs so that you can look for alternative products that do not contain EDCs. Often, products are marked as being free of a specific EDC so read labels carefully.
- Bisphenol A are found in the lining of food and beverage cans. It is also found in the thermal paper receipts that we receive from grocery and retail stores. It was banned in the United States in 2013 from baby bottles and sippy cups.
- Parabens are a type of preservative and are mainly used in cosmetics to prolong their shelf life. You’ll also find them in shampoos, shower gels and body washes.
- Triclosan is added to personal care products as an antibacterial and antifungal agent. It was added to antibacterial liquid hand soaps, toothpastes and some cosmetics. It was banned in the United States in 2017 for use in antibacterial liquid hand soaps.
- Phthalates are also referred to as plasticizers. They are used to soften vinyl and make PVC more flexible. You'll find phthalates in flooring, synthetic leather, fabrics that are coated and automobile interiors.
- PFAS are found in the food packaging such as pizza boxes, and nonstick products including frying pans. It has also been found in drinking water. This category includes PFOA, PFOS, and GenX.
NHANES data and analysis considerations
If you work in environmental health, you may want to consider the CDC National Health and Nutrition Examination Survey (NHANES) data in your studies. This is a survey research program conducted by the National Center for Health Statistics (NCHS) to assess the overall health and nutritional status of adults and children in the United States. The survey contains demographics, dietary, examination, laboratory and questionnaire data. The continuous NHANES survey has been run from 1999 to current day. I needed to approach the analysis of this type of data set differently from the typical data sets that I analyze. The methodology to analyze this data is complex and I will provide guidelines for simplifying the analysis and include SAS code examples.
Research Question
I used the NHANES data set from 2013-2014 to examine the relationship between phthalates and cognitive functioning in US adults age 60 or older. To do this, I required variables that spanned three of the NHANES data sets: demographics, questionnaire (cognitive functioning) and laboratory (phthalates and plasticizers).
Difference #1: NHANES uses multi-stage probability sampling
The reason that analyzing the NHANES data is complex is because the data was collected using a 4-stage probability sampling model. In this sampling model, counties are first selected, followed by segments or city blocks, then households and finally individuals within a household. This is not a simple random sample. This is a clustered design. A cluster in this case represents a county, city block, or household. If clustering is not taken into consideration during analysis, you may not obtain the appropriate standard errors and confidence intervals (Lee, 2010).
Difference #2: This sampling strategy requires weighting
This complex sampling procedure also requires weighting to be taken into consideration. Each person is assigned a sample weight. The sample weight is a measure that the reflects the number of people in the population that are represented by that person in the sample. The weighting rules are published on the NHANES website and the proper weight must be identified prior to analysis as that is input into both the descriptive statistics and the regression model. But there are weights for the demographics, the questionnaire and the laboratory data sets! Does this mean that you have to use multiple weights? No, you only need to specify one weight but it must be the correct weight.
How to pick the correct weight
For each data set that you use, you will need to review the Analytic Notes section in the Doc file for that dataset. Here were my candidates for the weighting variable for the 2013-2014 datasets that I considered:
- Demographics (WTINT2YR - Full sample 2-year interview weight) or (WTMEC2YR –Full sample 2-year MEC exam weight)
- Questionnaire (WTMEC2YR –Full sample 2-year MEC exam weight)
- Phthalates and Plasticizers Laboratory (WTSB2YR - Environmental B 2-year weights)
The rule is to select the weight with the smallest subpopulation. In my case, I had about 10,175 observations after combining the three datasets. When I selected those observations with completed phthalates labs, I was left with 2660. Therefore, the smallest subpopulation was those who had completed the labs which lead me to use the Phthalates and Plasticizers Laboratory weight (WTSB2YR) for my analysis. For more guidance on how to pick the correct weight, see the NHANES Module 3: Weighting.
Difference #3: This analysis requires the SAS survey procedures
In this case of a complex sampling strategy, the SAS Survey Procedures must be used because they take the sampling strategy into consideration. PROC SURVEYMEAN is used to generate the mean statistics, PROC SURVEYFREQ is used for the frequency analysis of categorical variables and PROC SURVEYREG is used to create the linear regression model. There is also a PROC SURVEYLOGISTIC if you need to perform logistic regression.
PROC SURVEYMEAN and PROC SURVEYREG require that these variables be supplied for analysis:
- Stratum (SDMVSTRA)
- Cluster (SDMVPSU)
- Subsample Weight (WTSB2YR), from the Phthalates and Plasticizers Laboratory data set.
I’ve provided code examples below that show the Stratum, Cluster and Subsample Weight variables in use.
Code example for PROC SURVEYMEAN
proc surveymeans data=nhanes.mydata nobs mean stderr max min range clm; stratum SDMVSTRA; cluster SDMVPSU; class ; var <var>; weight WTSB2YR; run; </var> |
Code example for PROC SURVEYREG
proc surveyreg data=nhanes.mydata order=formatted; stratum SDMVSTRA; cluster SDMVPSU; weight WTSB2YR; class ; model /solution adjrsq; run; |
To summarize, the three key differences to consider when working with NHANES data include:
- Multi-stage probability sampling strategy
- The inclusion of variables to represent the cluster, stratum and weight in the analysis, and
- The use of the SAS survey procedures to perform the analysis.
I hope that you are now more familiar with EDCs and that you feel confident using the NHANES data to answer your own research questions using SAS. In a future article I'll share the findings from my research on the impact of EDCs using the NHANES data.
References
Lee, J. (2010). An Exercise Using PROC SURVEYREG and NYC HANES: Examining Social Support as a Predictor of Body Mass Index in New York City. Retrieved from https://www.lexjansen.com/nesug/nesug10/cc/cc18.pdf
Trasande, L. (2019). Sicker, fatter, poorer: The urgent threat of hormone-disrupting chemicals to our health and future… and what we can do about it. New York, NY: Houghton Mifflin Harcourt Publishing Company.