I had the pleasure of speaking at the inaugural “Accounting IS Big Data” conference this past week in New York City, a meeting organized by the American Accounting Association. In addition to giving several talks, I participated in breakout sessions in which attendees discussed how analytics is used to monitor and improve accounting practices and firm performance. A recurring theme in the breakouts was the need for strong forecasts of financial performance and, like their economist brethren, accountants desire to understand causal drivers of specific cost line items. My time at the meeting made my think of all the fantastic advancements for forecasting and causal modeling in SAS/ETS® in the past few releases. I thought I would take this opportunity to highlight a few of those features for panel data models and model comparison.
SAS/ETS® version 14.1 was released in June, 2015, and continues the tradition of bringing new analytical features to SAS users. I will highlight some of the most interesting features in this release, though for a complete list there is a thorough accounting on our documentation page of What's New in SAS/ETS 14.1 .
Panel data continue to be a core focus of SAS/ETS development, with many new models in this release. Among these are new panel models for both continuous and non-linear response variables. The PANEL procedure adds two new models, the Hausman-Taylor and Amemiya-McCurdy estimators. These estimators for linear response panel data allow for a relaxation of the assumption on how the included variables are correlated with the error component in a model with random intercepts. The value is that parameters on non-time varying covariates are estimable in this model while maintaining consistency properties similar to a model with fixed effects. The QLIM procedure has several new models for panel data, namely the option to include random effects (random intercepts) in models with non-linear responses. This release now allows users to estimate logit/probit, censored, truncated, sample selection, tobit and other models using data with repeated observations such as those collected from loyalty card programs.
Model comparison is another area of enhancement. Quicker computations resulting from more efficient data handling and parallelization have created an opportunity to fit several models and compare those estimates. The PANEL procedure has a new COMPARE statement. When used with multiple models, this statement will create a nicely formatted table comparing the coefficient estimates and fit statistics of the models. The QLIM and COUNTREG procedures also receive the addition of marginal probabilities for their Bayesian models. Marginal probabilities provide a modeler with the ability to compare the “fit” across models of a given model specification. In some ways it is the Bayesian counterpart to using information criteria to rank models in a frequentist world.
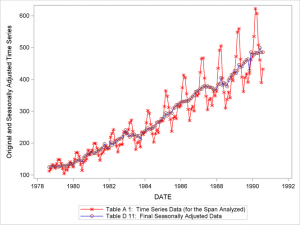
There are many other enhancements in the release that I hope you will try. In fact, you can try one of these enhancements right now! The X-13 Procedure debuts in this release and I’m going to show you how to try it out. Using our cloud-enabled SAS Studio® interface (free for teaching and learning), you can “kick the tires” on all the new features I have listed.
data sales;
   set sashelp.air;
   sales = air;
   date = intnx( 'month', '01sep78'd, _n_-1 );
   format date monyy.;
run;
title 'TRAMO Automatic Model Identification';
proc x13 data=sales date=date;
   var sales;
   transform function=log;
   regression predefined=td;
   automdl maxorder=(1,1) print=all;
   estimate;
   x11;
   output out=out a1 a2 a6 b1 c17 c20 d1 d7 d8 d9 d10 d11 d12 d13 d16 d18;
run;
Simply use this URL to sign up for an account and copy and paste the code into the code window. Your code will run in the cloud and your results will appear in your browser. Pretty Cool!


