It is a mild summer evening in July at Lake Neusiedl here in Austria. The participants of the traditional YES Cup Regatta are sitting with beer and barbecue chops on the terrace of our clubhouse. The mood is relaxed, and everyone wants to tell their story after two eventful races.
A conversation at the end of our table draws my attention, because it is about forecasting, more specifically the usability and accuracy of weather and wind forecasts. As expected, the opinions differ substantially. From "mostly wrong" to "we should be thankful that we have them – in earlier times no forecast existed on that level of detail" to "I make my decisions based on the cloud pictures."
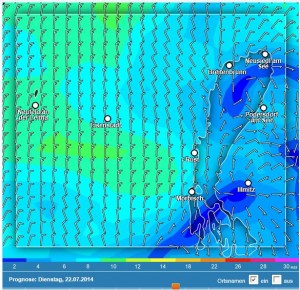
Knowing the wind conditions before a regatta is important, to enable good decisions such as: "With what size of the sail shall I use to start the race, so that I don’t have to change during the regatta" or "What wind direction will prevail and which areas of the lake will therefore be favored?"
Marc, an old stager in race sailing, explains his use of wind forecasts as follows:
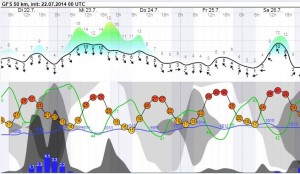
"I always consider several available forecasts; Windguru, Windfinder, Otto Lustyk, swz.at and ORF Burgenland . So I get a picture of the diversity or uniformity of the possible wind scenarios - because obviously the stations use different weather models. So I can judge whether weather and wind for the race weekend is easy or hard to predict and how much I can trust the forecasts in general. In addition, I also monitor how much the predictions for the weekend change during the week. If they stay stable all week, the weather seems to allow a clear prediction; if the predictions change daily, it seems that we get very unstable whether conditions. On the race day itself, watching the clouds and the sky is very important. Short-term and local facts cannot be included in these models and give me additional information based on my experience.”
A smile can be seen on my face, and I intentionally do not participate in the conversation, because I do not want to be seen as the statistician who “always considers everything so mathematically." And even more importantly: there is nothing to add to Marc's statement. Without knowing, he has summarized the most important principles of business forecasting and talked about the proper handling of statistical forecasts. And although his professional background is definitely not in dealing with data, forecasts, or things like "business intelligence," at the next Analytics Conference Marc can work together with me at the forecasting demo station. Because what he has just explained represents important features in SAS® Forecast Server.
- Combine models for stable forecasts: " I always consider several available forecasts."
- Segmentation of time series - "I can judge whether weather and wind for the race weekend is easy or hard to predict."
- Confidence intervals for forecasts: "How much I can trust the forecasts in general"
- Forecast stability analysis and rolling simulations: "I also monitor how much the predictions for the weekend change during the week."
- Overwrites and judgemental forecasts: "Short-term and local facts cannot be included in these models and give me additional information."

So enjoy the fact that there is software that does the very things that people consider as intuitively correct, smile with satisfaction, and head towards the beer tap for another beer. At least, that's what we did after Marc shared his intuition with us.